Technical Analysis of THM 2024-05-10
Overview:
In analyzing the technical indicators for THM over the last 5 days, we will delve into the trend, momentum, volatility, and volume indicators to provide a comprehensive outlook on the possible stock price movement in the coming days. By examining these key aspects, we aim to offer valuable insights and predictions to guide your investment decisions.
Trend Indicators:
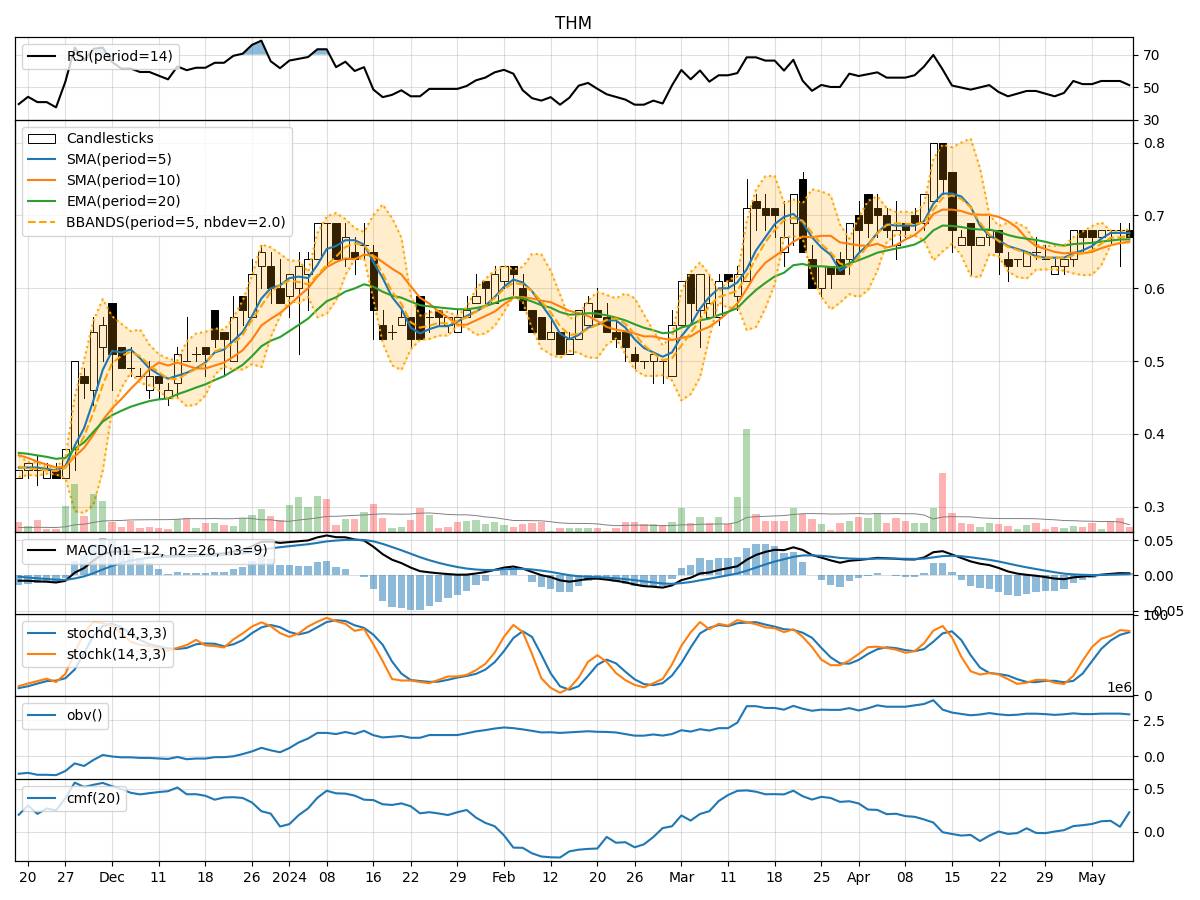
- Moving Averages (MA): The 5-day MA has been consistently above the closing prices, indicating a short-term uptrend.
- MACD: The MACD line has been positive, with the MACD histogram showing an increasing trend, suggesting bullish momentum.
- EMA: The EMA has been steadily rising, supporting the bullish sentiment in the short to medium term.
Momentum Indicators:
- RSI: The RSI has been hovering around the neutral zone, indicating a balanced momentum without extreme overbought or oversold conditions.
- Stochastic Oscillator: Both %K and %D have been in the overbought territory, signaling potential for a pullback.
- Williams %R: The indicator has been fluctuating but recently moved towards oversold levels, hinting at a possible reversal.
Volatility Indicators:
- Bollinger Bands: The bands have narrowed, suggesting decreased volatility and a potential period of consolidation.
- Bollinger %B: The %B indicator is near the lower band, indicating a possible oversold condition.
Volume Indicators:
- On-Balance Volume (OBV): The OBV has been relatively flat, indicating a balance between buying and selling pressure.
- Chaikin Money Flow (CMF): The CMF has shown some fluctuations but remains positive, indicating buying pressure in the market.
Key Observations and Opinions:
- Trend: The trend indicators suggest a bullish bias in the short to medium term.
- Momentum: Momentum indicators show a mixed picture, with potential for a pullback in the near future.
- Volatility: Volatility indicators point towards a period of consolidation and a potential reversal.
- Volume: Volume indicators indicate a balanced market sentiment with no clear dominance.
Conclusion:
Based on the analysis of the technical indicators, the next few days for THM stock price movement could see a sideways consolidation with a slight downward bias. Traders should watch for potential reversal signals in momentum indicators and monitor volume for any shifts in market sentiment. It is advisable to exercise caution and wait for clearer signals before making significant trading decisions.