Technical Analysis of TRX 2024-05-10
Overview:
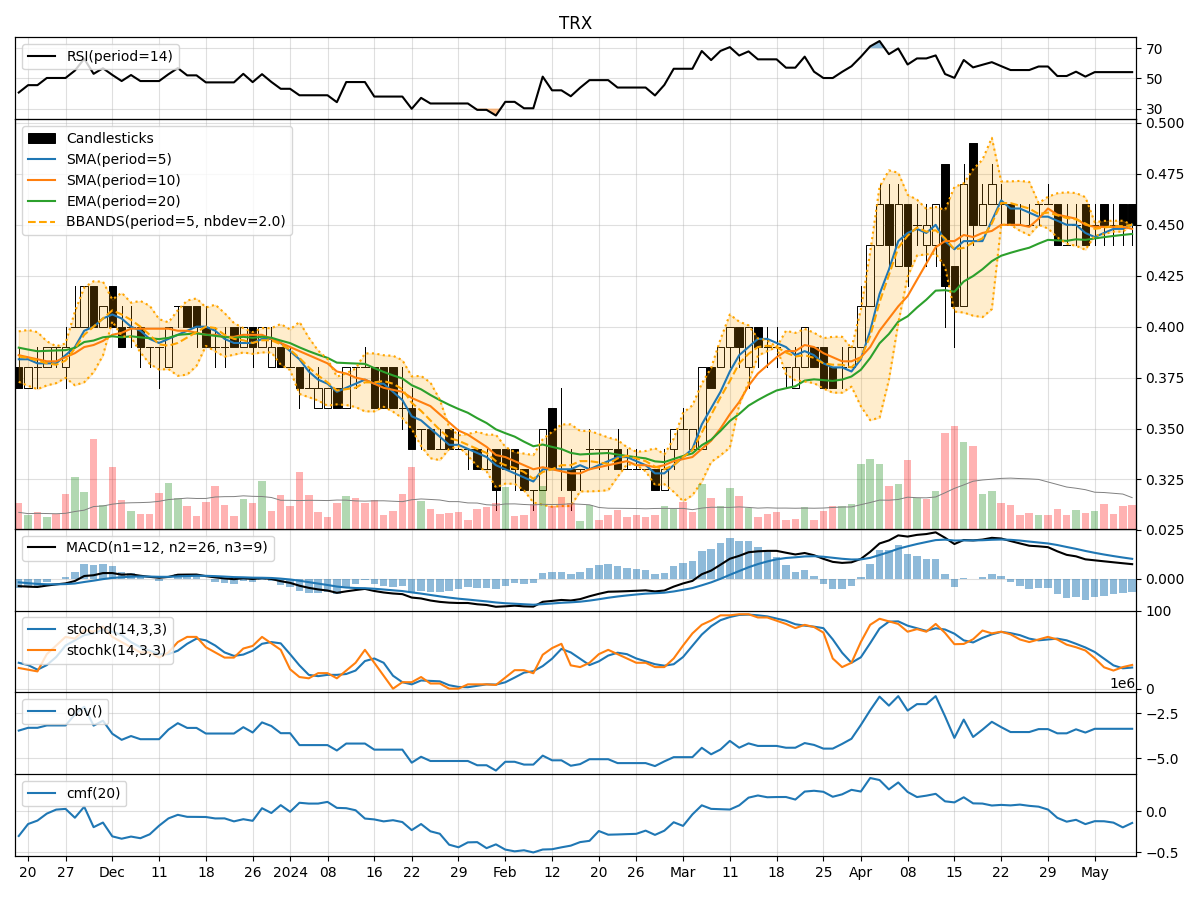
In analyzing the technical indicators for TRX over the last 5 days, we will delve into the trend, momentum, volatility, and volume indicators to provide a comprehensive outlook on the possible stock price movement in the coming days. By examining these key aspects, we aim to offer valuable insights and recommendations for potential trading strategies.
Trend Analysis:
- Moving Averages (MA): The 5-day Moving Average (MA) has been relatively stable around 0.45, indicating a consistent price level.
- MACD and Signal Line: The MACD has been positive, suggesting a bullish momentum, although the MACD Histogram has been decreasing slightly.
Momentum Analysis:
- RSI: The Relative Strength Index (RSI) at 54.25 is in the neutral zone, not indicating any extreme overbought or oversold conditions.
- Stochastic Oscillator: Both %K and %D have been trending upwards, but not in the overbought territory.
Volatility Analysis:
- Bollinger Bands (BB): The bands have been relatively narrow, indicating low volatility and a period of consolidation.
Volume Analysis:
- On-Balance Volume (OBV): The OBV has been relatively flat, suggesting a balance between buying and selling pressure.
- Chaikin Money Flow (CMF): The CMF has been negative, indicating a slight distribution phase.
Key Observations:
- Trend: The stock has been trading around the 5-day MA with a slightly positive MACD, indicating a potential bullish bias.
- Momentum: The RSI and Stochastic Oscillator suggest a neutral to slightly positive momentum.
- Volatility: The narrow Bollinger Bands point towards a period of consolidation and low volatility.
- Volume: The OBV and CMF indicate a balanced volume with a slight distribution phase.
Conclusion:
Based on the analysis of the technical indicators, the next few days for TRX could see sideways movement with a slight bullish bias. The stock is likely to continue trading within a tight range, with limited volatility and a balanced volume. Traders may consider adopting a range-bound strategy or wait for a clearer trend confirmation before taking significant positions. It is essential to monitor key levels and indicators for any potential shifts in market dynamics.