Technical Analysis of VZLA 2024-05-10
Overview:
In analyzing the technical indicators for VZLA stock over the last 5 days, we will delve into the trend, momentum, volatility, and volume indicators to provide a comprehensive outlook on the possible stock price movement in the coming days. By examining these key indicators, we aim to offer valuable insights and predictions for potential investors.
Trend Analysis:
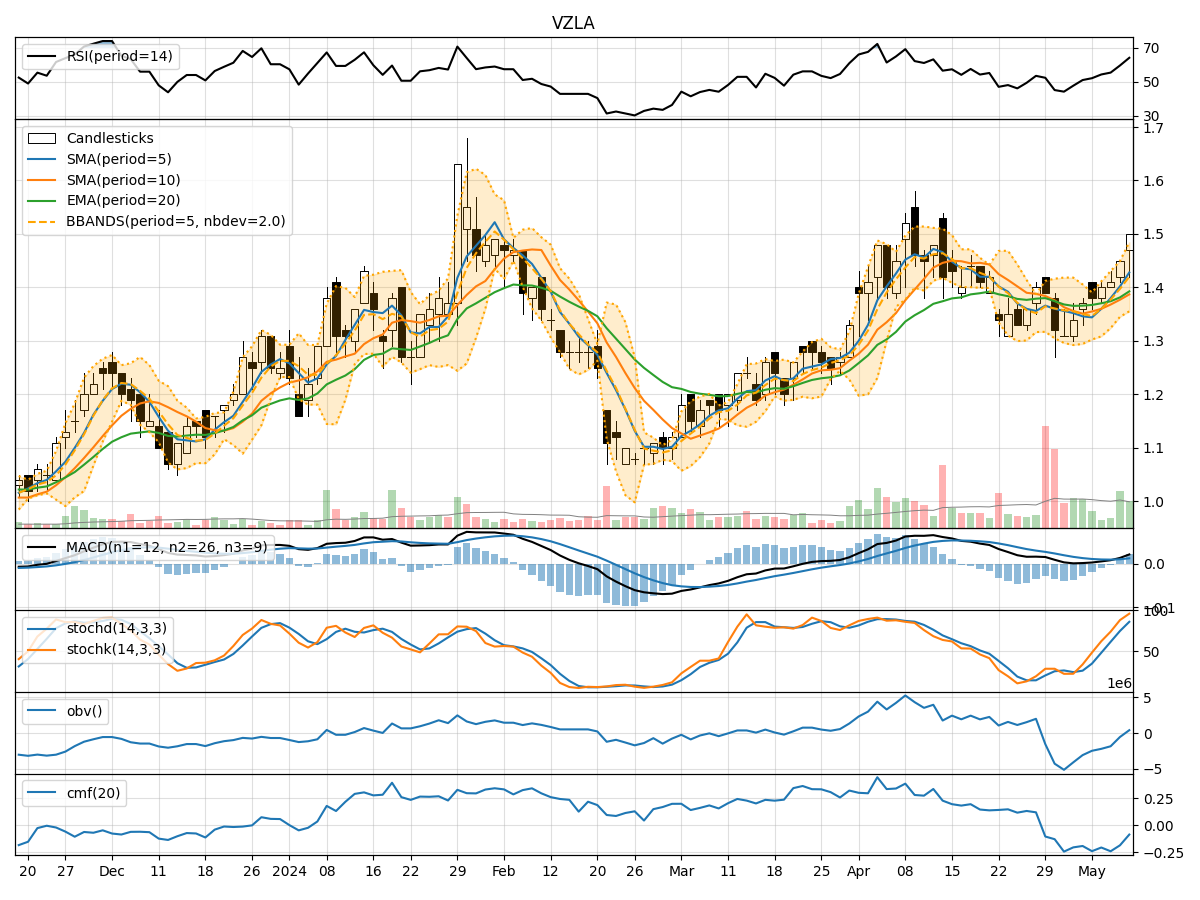
- Moving Averages (MA): The 5-day Moving Average (MA) has been consistently increasing, indicating a bullish trend in the short term.
- MACD: The MACD line has been above the signal line for the past 5 days, suggesting a bullish momentum.
- EMA: The Exponential Moving Average has also been on an upward trajectory, supporting the bullish trend.
Key Observation: The trend indicators point towards a strong bullish sentiment in the stock price movement.
Momentum Analysis:
- RSI: The Relative Strength Index has been steadily increasing and is currently in the overbought territory, indicating a strong buying momentum.
- Stochastic Oscillator: Both %K and %D lines are in the overbought zone, suggesting a potential reversal or consolidation.
- Williams %R: The indicator is in the oversold region, signaling a potential reversal in the short term.
Key Observation: The momentum indicators show a mixed signal with a possibility of a short-term reversal or consolidation.
Volatility Analysis:
- Bollinger Bands: The stock price has been trading above the upper Bollinger Band, indicating overbought conditions and a potential reversal.
- Bollinger %B: The %B indicator is above 1, further confirming the overbought status.
- Average True Range (ATR): The volatility has increased over the last 5 days, suggesting heightened price fluctuations.
Key Observation: The volatility indicators suggest a potential reversal due to overbought conditions and increased price fluctuations.
Volume Analysis:
- On-Balance Volume (OBV): The OBV has been declining, indicating a divergence between price and volume, which could signal a potential trend reversal.
- Chaikin Money Flow (CMF): The CMF is negative, reflecting selling pressure in the stock.
Key Observation: The volume indicators point towards a bearish sentiment with selling pressure in the stock.
Conclusion:
Based on the analysis of the trend, momentum, volatility, and volume indicators, the overall outlook for VZLA stock suggests a potential reversal in the coming days. While the trend indicators indicate a strong bullish sentiment, the momentum and volume indicators point towards a possible short-term reversal or consolidation. The overbought conditions highlighted by the volatility indicators further support the likelihood of a downward movement in the stock price.
Recommendation:
Considering the mixed signals from the technical indicators, investors should exercise caution and closely monitor the stock price for signs of a reversal or consolidation. It is advisable to wait for confirmation of a new trend direction before making any significant trading decisions. Additionally, incorporating fundamental analysis alongside technical analysis can provide a more comprehensive view of the stock's potential future movements.