Technical Analysis of ABCL 2024-05-10
Overview:
In analyzing the technical indicators for ABCL stock over the last 5 days, we will delve into the trend, momentum, volatility, and volume indicators to provide a comprehensive outlook on the possible stock price movement in the coming days. By examining these key indicators, we aim to offer valuable insights and predictions to guide investment decisions.
Trend Analysis:
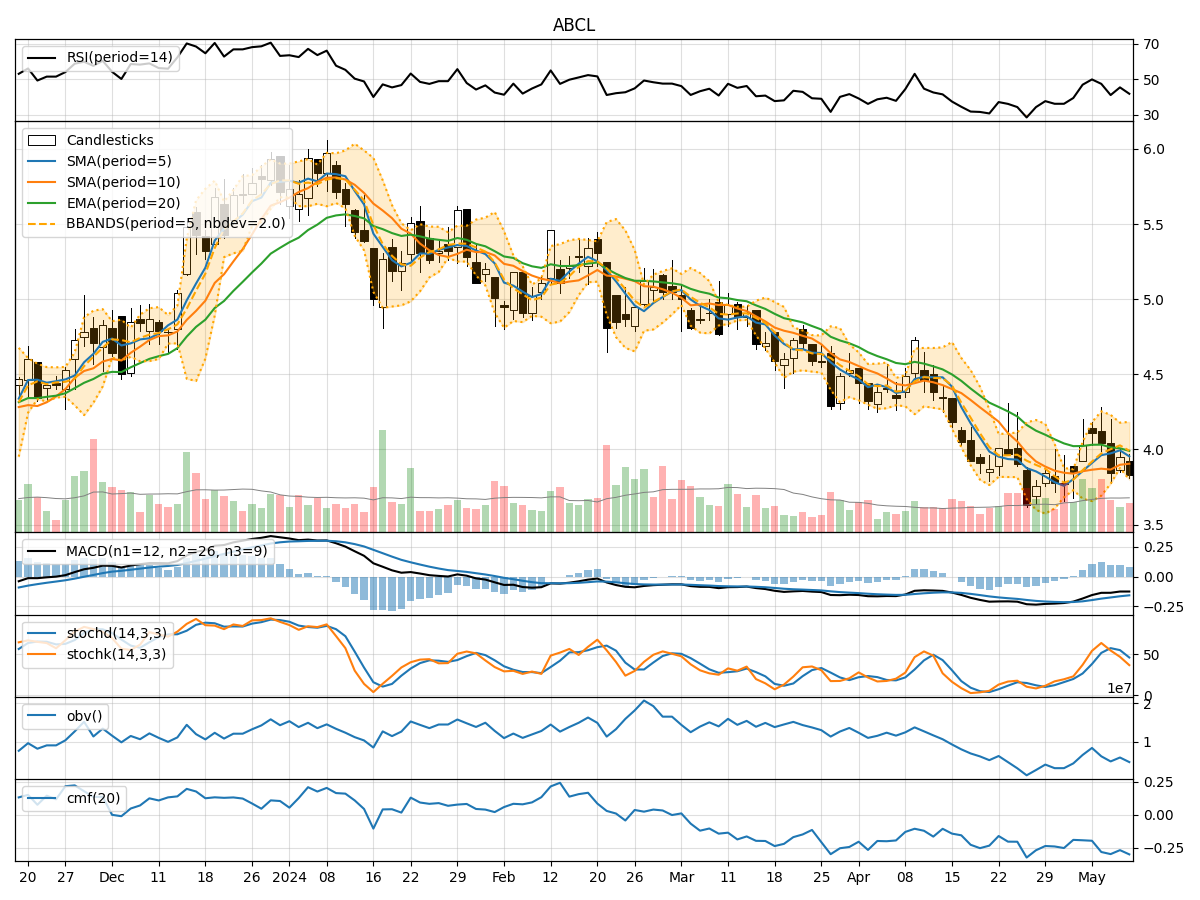
- Moving Averages (MA): The 5-day moving average (MA) has been fluctuating around the current stock price, indicating a lack of clear trend direction.
- MACD: The MACD line has been consistently below the signal line, suggesting a bearish momentum in the short term.
- EMA: The exponential moving average has been declining, indicating a downward trend in the stock price.
Momentum Analysis:
- RSI: The Relative Strength Index (RSI) has been hovering around the 50 level, reflecting a neutral momentum in the stock.
- Stochastic Oscillator: Both %K and %D lines of the stochastic oscillator have been trending downwards, signaling a bearish momentum.
- Williams %R: The Williams %R indicator has been in the oversold territory, indicating a potential reversal in the stock price.
Volatility Analysis:
- Bollinger Bands: The Bollinger Bands have been narrowing, suggesting decreasing volatility in the stock price.
- Bollinger %B: The %B indicator has been fluctuating within a tight range, indicating a period of consolidation.
Volume Analysis:
- On-Balance Volume (OBV): The OBV indicator has been declining, indicating selling pressure in the stock.
- Chaikin Money Flow (CMF): The CMF has been negative, suggesting a lack of buying interest in the stock.
Key Observations:
- The stock is currently in a downtrend based on the moving averages and MACD indicators.
- Momentum indicators like RSI and Stochastic Oscillator suggest a bearish sentiment in the short term.
- Volatility is decreasing, indicating a period of consolidation or sideways movement.
- The volume indicators reflect selling pressure and a lack of significant buying interest.
Conclusion:
Based on the analysis of the technical indicators, the next few days are likely to see the stock price continue its downward trend with bearish momentum. Traders and investors should exercise caution and consider waiting for more positive signals before considering long positions. The stock is currently not showing strong indications of a reversal or significant upward movement.