Technical Analysis of ABLV 2024-05-10
Overview:
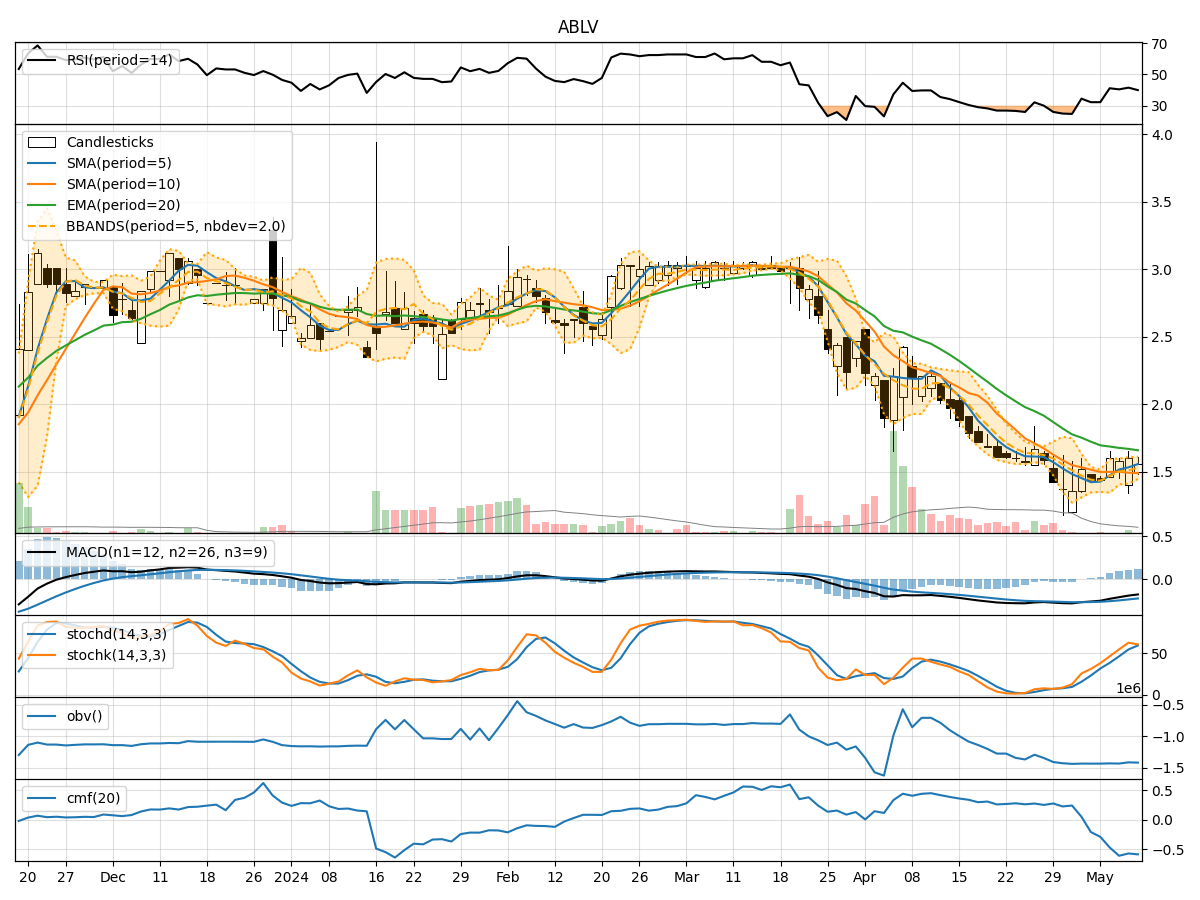
In analyzing the technical indicators for ABLV stock over the last 5 days, we will delve into the trends, momentum, volatility, and volume aspects to provide a comprehensive outlook on the possible future stock price movement. By examining key indicators such as moving averages, MACD, RSI, Stochastic Oscillator, Bollinger Bands, and On-Balance Volume (OBV), we aim to offer valuable insights and predictions for the upcoming trading days.
Trend Analysis:
- Moving Averages (MA): The 5-day MA has been showing an upward trend, indicating a potential bullish momentum in the short term.
- MACD: The MACD line has been consistently below the signal line, suggesting a bearish sentiment in the stock.
- EMA: The EMA has been declining, reflecting a bearish outlook for the stock price.
Momentum Analysis:
- RSI: The RSI has been hovering around the 40-50 range, indicating neutral momentum without any extreme overbought or oversold conditions.
- Stochastic Oscillator: Both %K and %D have been fluctuating in the mid-range, suggesting a sideways momentum.
- Williams %R: The Williams %R is also indicating a neutral stance without any extreme signals.
Volatility Analysis:
- Bollinger Bands: The Bollinger Bands have shown a narrowing of the bands, indicating decreasing volatility and a possible consolidation phase.
- Bollinger %B: The %B indicator is below 1, suggesting that the stock is trading below the lower band, which could signal a potential buying opportunity.
- Bollinger Band Width: The Band Width has been decreasing, indicating a reduction in volatility.
Volume Analysis:
- On-Balance Volume (OBV): The OBV has been on a declining trend, indicating that selling pressure may be increasing.
- Chaikin Money Flow (CMF): The CMF has been consistently negative, suggesting outflow of money from the stock.
Conclusion:
Based on the analysis of the technical indicators, the stock of ABLV is currently in a bearish phase, with the MACD and EMA signaling downward momentum. The narrowing Bollinger Bands and decreasing volatility point towards a potential consolidation phase in the near future. The OBV and CMF indicators also suggest a negative sentiment in terms of volume and money flow.
Recommendation:
Considering the overall technical outlook, it is advisable to exercise caution with ABLV stock in the upcoming trading days. Investors may want to wait for more clarity in the price action and monitor for any signs of a reversal before considering any new positions. Downward movement or sideways consolidation is more likely in the short term.