Technical Analysis of ACBA 2024-05-10
Overview:
In analyzing the technical indicators for ACBA stock over the last 5 days, we will delve into the trend, momentum, volatility, and volume indicators to provide a comprehensive outlook on the possible stock price movement in the coming days. By examining these key indicators, we aim to offer valuable insights and predictions for potential investors.
Trend Analysis:
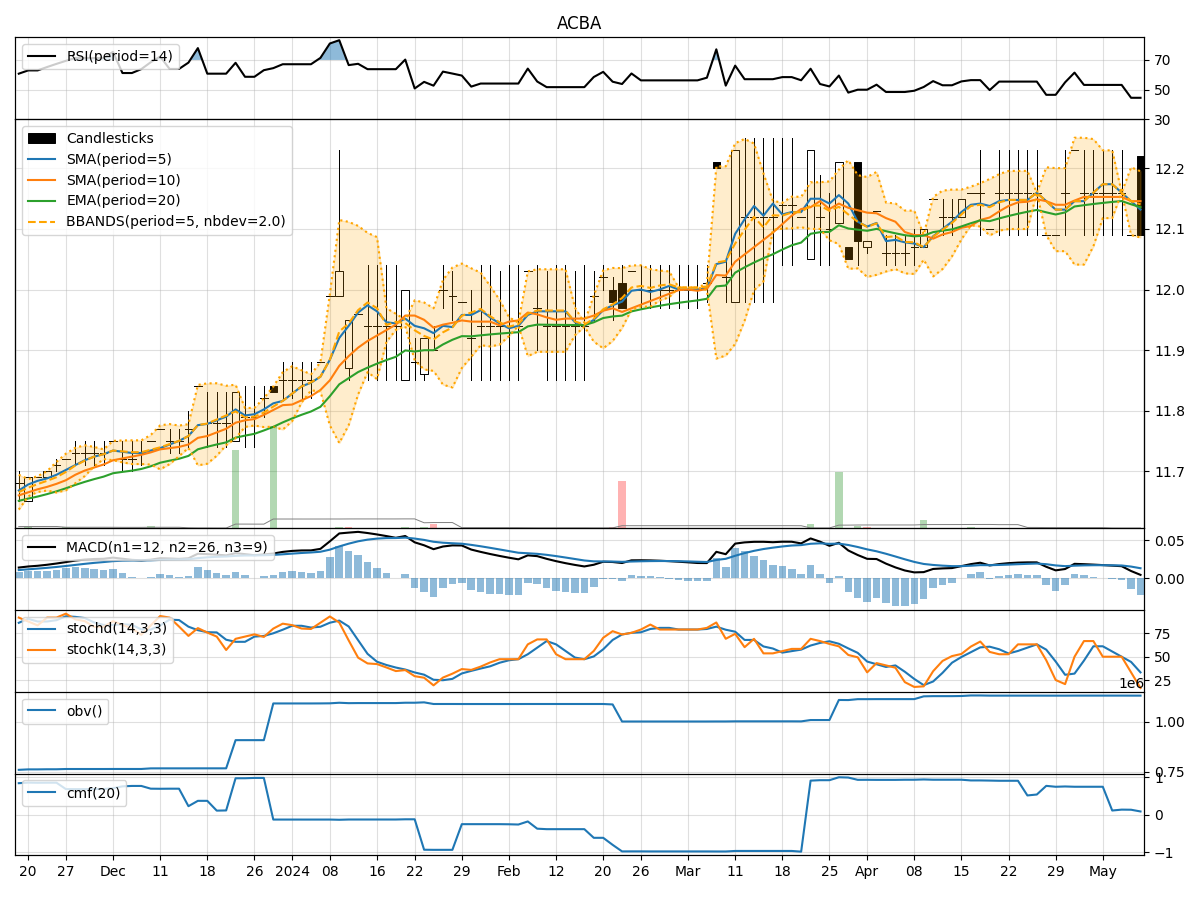
- Moving Averages (MA): The 5-day Moving Average (MA) has been fluctuating around the closing price, indicating a lack of clear trend direction.
- MACD: The MACD line has been positive, but the MACD Histogram has been decreasing, suggesting a potential weakening of bullish momentum.
- RSI: The Relative Strength Index (RSI) has been around 50, signifying a neutral stance in terms of momentum.
Momentum Analysis:
- Stochastic Oscillator: The Stochastic Oscillator has been decreasing, indicating a bearish momentum.
- Williams %R: The Williams %R has been consistently in oversold territory, suggesting a potential reversal in the short term.
Volatility Analysis:
- Bollinger Bands: The Bollinger Bands have been narrowing, indicating decreasing volatility in the stock price.
- Average True Range (ATR): The ATR has been relatively stable, suggesting a lack of significant price fluctuations.
Volume Analysis:
- On-Balance Volume (OBV): The OBV has been relatively flat, indicating a balance between buying and selling pressure.
- Chaikin Money Flow (CMF): The CMF has been positive but decreasing, signaling a potential outflow of money from the stock.
Key Observations:
- The stock is currently in a consolidation phase with no clear trend direction.
- Momentum indicators suggest a bearish bias in the short term.
- Volatility is decreasing, indicating a potential period of price stability.
- Volume indicators show a balance between buying and selling pressure.
Conclusion:
Based on the analysis of the technical indicators, the outlook for ACBA stock in the next few days is bearish. The lack of a clear trend, coupled with bearish momentum signals and decreasing volatility, suggests that the stock may experience downward pressure. Investors should exercise caution and consider waiting for more definitive signals before making trading decisions.