Technical Analysis of ACHV 2024-05-10
Overview:
In analyzing the technical indicators for ACHV over the last 5 days, we will delve into the trend, momentum, volatility, and volume indicators to provide a comprehensive outlook on the possible stock price movement in the coming days. By examining these key indicators, we aim to offer valuable insights and predictions to guide your investment decisions.
Trend Analysis:
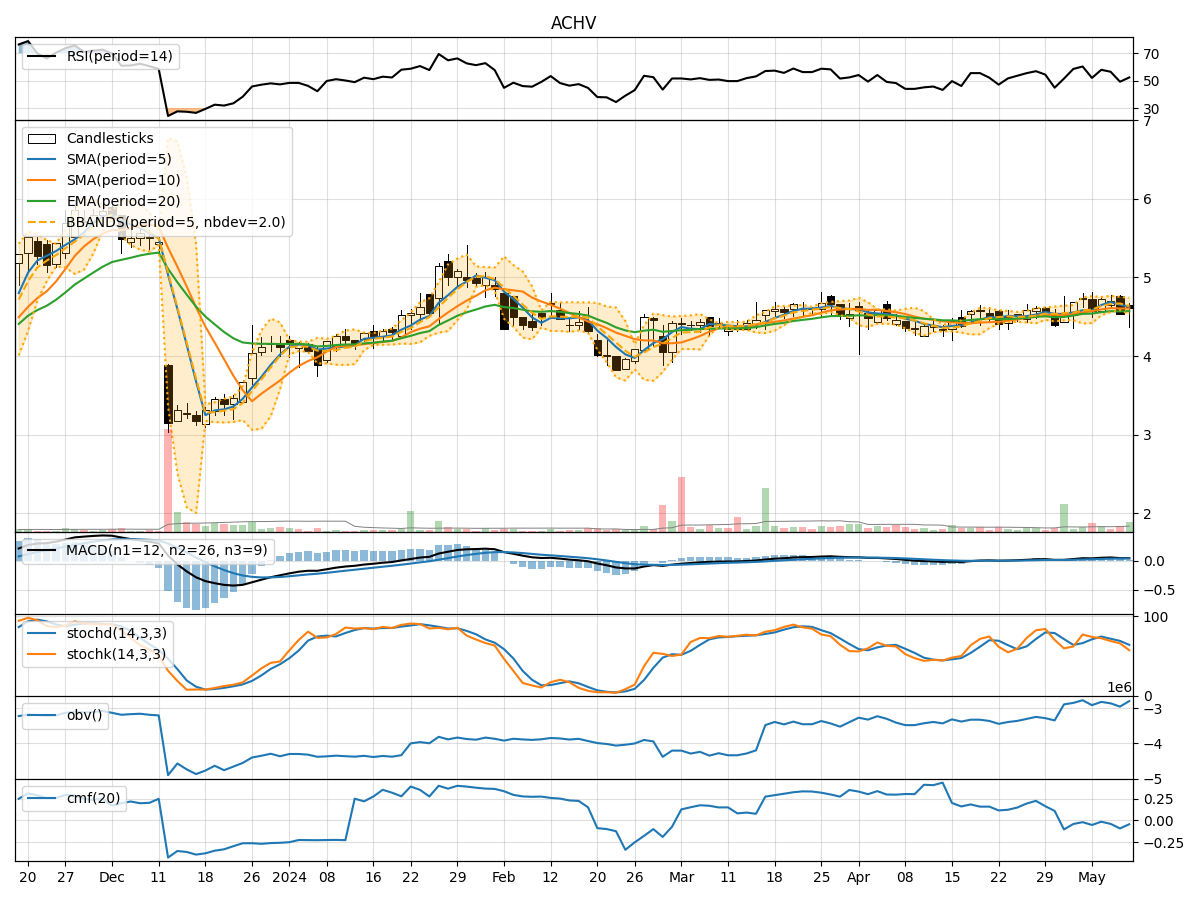
- Moving Averages (MA): The 5-day Moving Average (MA) has been fluctuating around the closing prices, indicating a relatively stable trend.
- MACD: The Moving Average Convergence Divergence (MACD) shows positive values, suggesting a bullish momentum in the short term.
Key Observation: The trend indicators point towards a bullish sentiment in the short term.
Momentum Analysis:
- RSI: The Relative Strength Index (RSI) has been oscillating around the mid-level, indicating a neutral momentum.
- Stochastic Oscillator: Both %K and %D values are declining, signaling a potential reversal in momentum.
Key Observation: The momentum indicators suggest a neutral to bearish outlook in the near future.
Volatility Analysis:
- Bollinger Bands (BB): The bands have been narrowing, indicating decreasing volatility in the stock price.
Key Observation: Volatility is decreasing, which may lead to a consolidation phase in the stock price.
Volume Analysis:
- On-Balance Volume (OBV): The OBV has been fluctuating, showing no clear trend in volume accumulation.
- Chaikin Money Flow (CMF): The CMF is negative, indicating a lack of buying pressure.
Key Observation: Volume indicators suggest a lack of strong buying interest in the stock.
Conclusion:
Based on the analysis of the technical indicators, the stock of ACHV is likely to experience a short-term bullish trend supported by the moving averages and MACD. However, the momentum indicators and volume analysis point towards a neutral to bearish sentiment in the near future. The decreasing volatility suggests a consolidation phase may be on the horizon.
Recommendation:
Considering the mixed signals from the indicators, it is advisable to exercise caution in trading ACHV. Investors may consider waiting for more clarity in momentum and volume before making significant trading decisions. Monitoring key support and resistance levels can help in identifying potential entry and exit points.
Overall View: The stock price of ACHV may exhibit upward movements in the short term but could face resistance due to neutral to bearish momentum and lackluster volume. Traders should remain vigilant and adapt their strategies accordingly to navigate the potential market fluctuations.