Technical Analysis of ADP 2024-05-10
Overview:
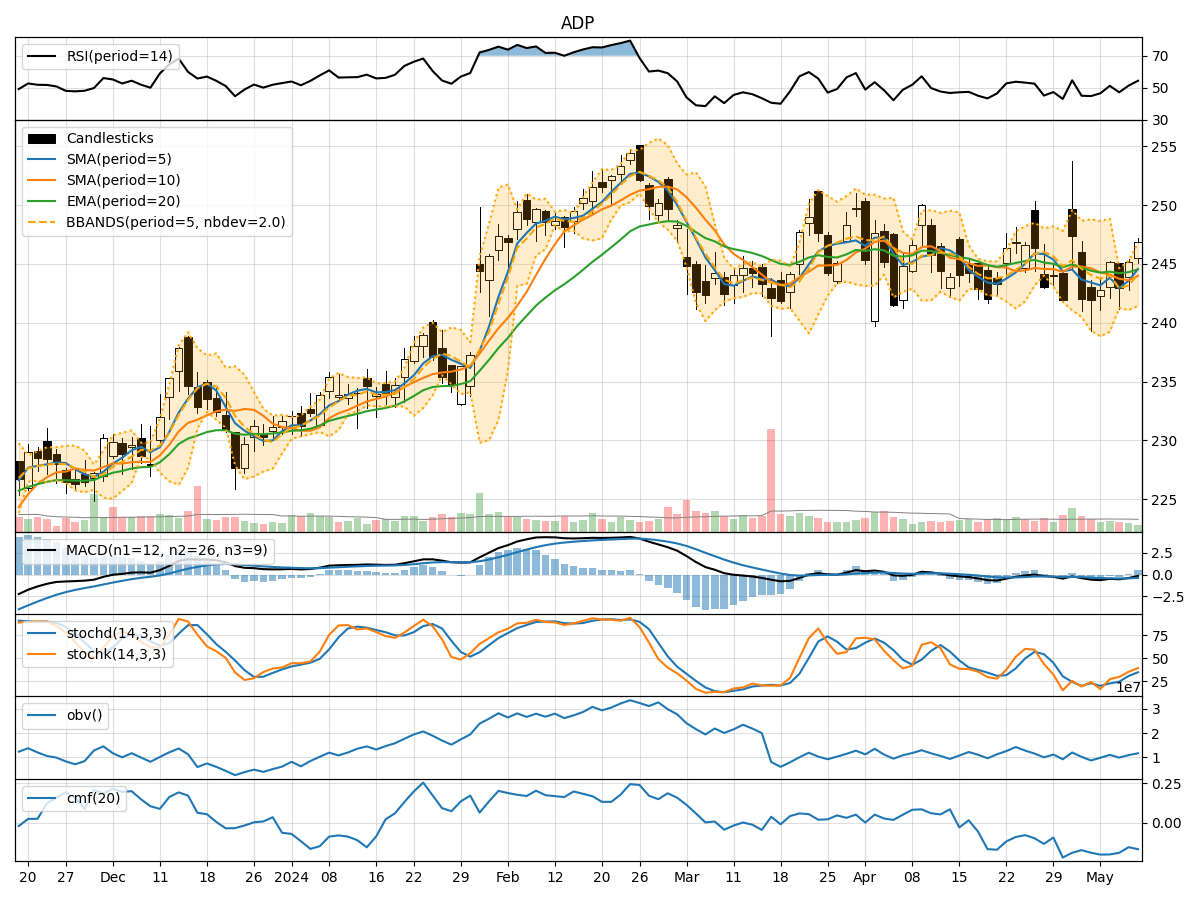
In analyzing the technical indicators for ADP over the last 5 days, we will delve into the trend, momentum, volatility, and volume indicators to provide a comprehensive outlook on the possible stock price movement in the coming days.
Trend Analysis:
- Moving Averages (MA): The 5-day Moving Average (MA) has been fluctuating around the closing prices, indicating short-term price trends. The Simple Moving Average (SMA) and Exponential Moving Average (EMA) show a slight downward trend, with the EMA lagging behind.
- MACD: The Moving Average Convergence Divergence (MACD) has been negative, suggesting a bearish momentum in the short term.
Momentum Analysis:
- RSI: The Relative Strength Index (RSI) has been hovering around the neutral zone, indicating a lack of strong momentum in either direction.
- Stochastic Oscillator: Both %K and %D have been gradually increasing, suggesting a potential bullish momentum building up.
Volatility Analysis:
- Bollinger Bands (BB): The Bollinger Bands have been narrowing, indicating decreasing volatility in the stock price.
Volume Analysis:
- On-Balance Volume (OBV): The OBV has been showing a slight decrease, indicating a potential distribution phase.
- Chaikin Money Flow (CMF): The CMF has been negative, suggesting a bearish pressure on the stock.
Key Observations:
- The trend indicators show a mixed signal with a slight bearish bias in the short term.
- Momentum indicators suggest a potential bullish momentum building up.
- Volatility has been decreasing, indicating a possible consolidation phase.
- Volume indicators point towards a distribution phase with bearish pressure.
Conclusion:
Based on the analysis of the technical indicators, the next few days for ADP stock price movement could see sideways consolidation with a slight upward bias. Traders should closely monitor the momentum indicators for a potential shift in momentum towards the bullish side. However, the overall trend remains neutral to slightly bearish in the short term. It is advisable to wait for confirmation from key indicators before making any significant trading decisions.