Technical Analysis of ADSE 2024-05-10
Overview:
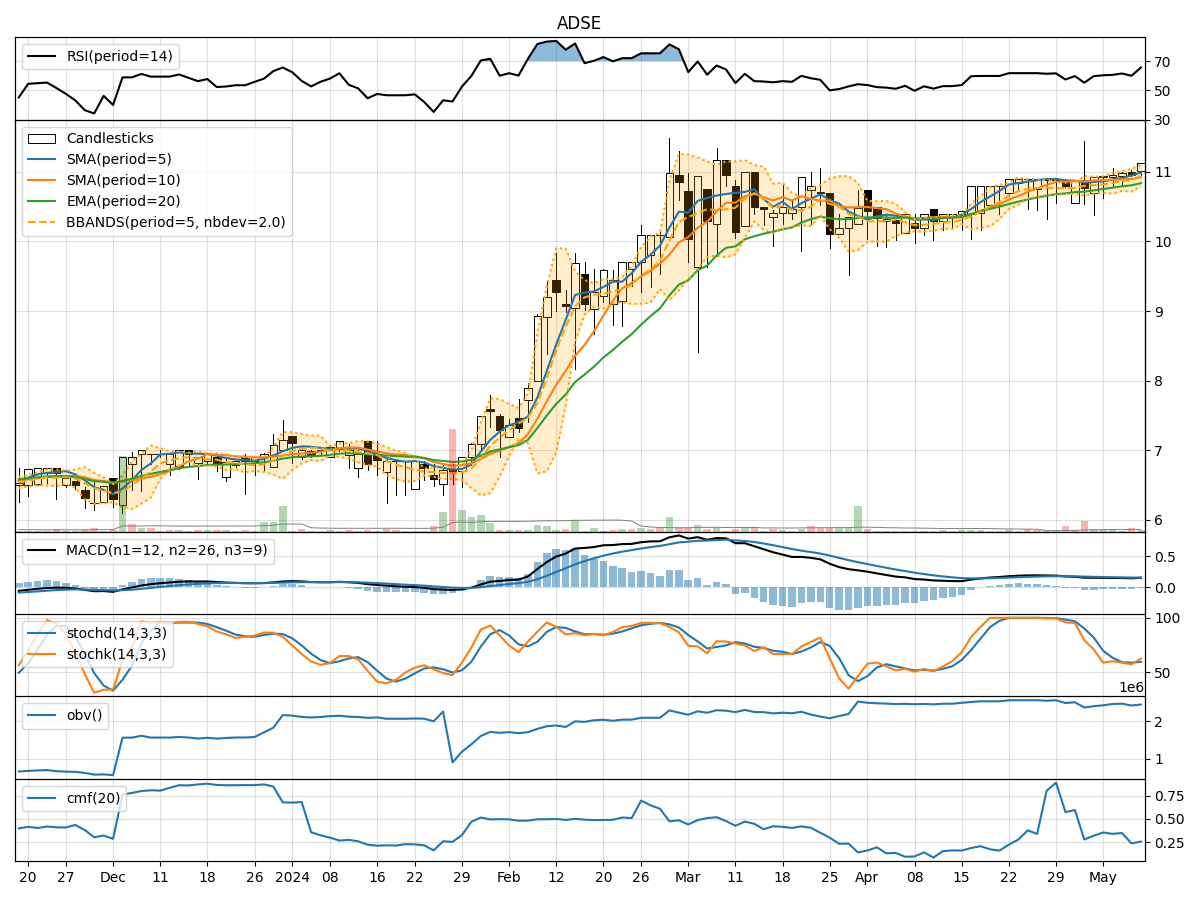
In analyzing the technical indicators for ADSE stock over the last 5 days, we will delve into the trend, momentum, volatility, and volume indicators to provide a comprehensive outlook on the possible stock price movement in the coming days.
Trend Indicators:
- Moving Averages (MA): The 5-day Moving Average (MA) has been trending upwards, indicating a positive momentum in the stock price.
- MACD: The MACD line has been consistently above the signal line, suggesting a bullish trend.
- EMA: The Exponential Moving Average (EMA) has been steadily increasing, supporting the bullish sentiment in the stock.
Momentum Indicators:
- RSI: The Relative Strength Index (RSI) has been fluctuating around the neutral zone, indicating a balanced momentum in the stock.
- Stochastic Oscillator: Both %K and %D have shown mixed signals, with %K hovering around the overbought territory, suggesting a potential reversal.
- Williams %R: The Williams %R is currently in the oversold region, indicating a possible buying opportunity.
Volatility Indicators:
- Bollinger Bands: The Bollinger Bands have shown fluctuations in the width, indicating periods of both high and low volatility.
- Bollinger %B: The %B indicator has been oscillating within the bands, reflecting the volatility in the stock price.
Volume Indicators:
- On-Balance Volume (OBV): The OBV has shown a slight increase, suggesting accumulation in the stock.
- Chaikin Money Flow (CMF): The CMF has been positive, indicating buying pressure in the stock.
Key Observations:
- The trend indicators suggest a bullish sentiment in the stock, supported by the moving averages and MACD.
- Momentum indicators show a mixed signal, with RSI indicating a neutral momentum, while stochastic oscillators hint at a potential reversal.
- Volatility indicators reflect fluctuations in the stock price, with Bollinger Bands showing periods of both high and low volatility.
- Volume indicators indicate a slight increase in accumulation and buying pressure in the stock.
Conclusion:
Based on the analysis of the technical indicators, the stock is likely to experience a period of consolidation in the coming days. While the trend indicators point towards a bullish sentiment, the mixed signals from momentum indicators and fluctuating volatility suggest a potential sideways movement. Traders should closely monitor key levels and wait for clearer signals before making any significant trading decisions.