Technical Analysis of AEHL 2024-05-10
Overview:
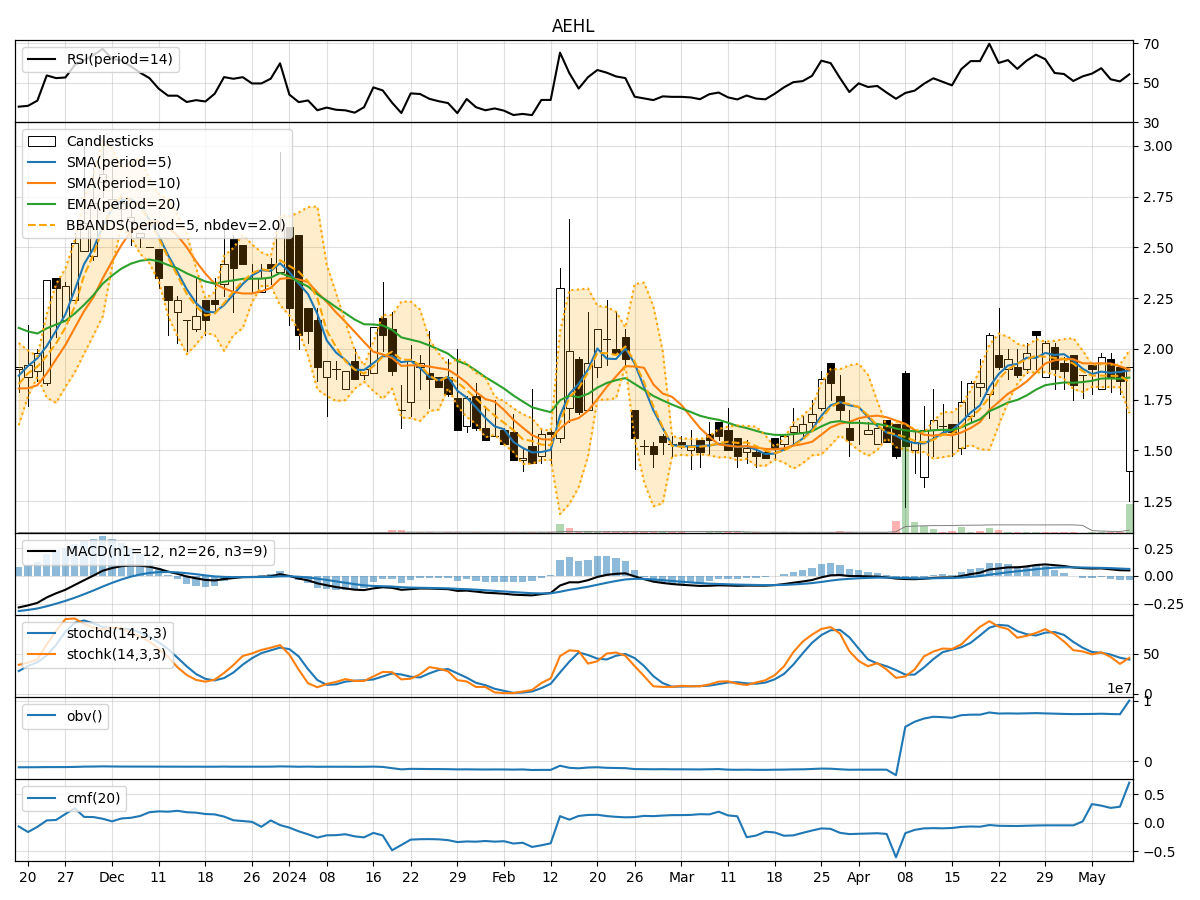
In analyzing the technical indicators for AEHL over the last 5 days, we will delve into the trend, momentum, volatility, and volume indicators to provide a comprehensive outlook on the possible stock price movement in the coming days. By examining these key indicators, we aim to offer valuable insights and predictions to guide your investment decisions.
Trend Analysis:
- Moving Averages (MA): The 5-day Moving Average (MA) has been fluctuating around the closing prices, indicating short-term price trends. The Simple Moving Average (SMA) and Exponential Moving Average (EMA) show a slight divergence, suggesting potential price volatility.
- MACD: The Moving Average Convergence Divergence (MACD) and its signal line (MACDH) have been consistently negative, indicating a bearish trend. However, the MACD histogram (MACDS) is showing signs of convergence, hinting at a possible trend reversal.
Momentum Analysis:
- RSI: The Relative Strength Index (RSI) has been hovering around the neutral zone, indicating a lack of strong momentum in either direction.
- Stochastic Oscillator: Both %K and %D lines of the Stochastic Oscillator are below 50, suggesting a bearish momentum. The Williams %R (WillR) is also in the oversold territory, indicating a potential reversal.
Volatility Analysis:
- Bollinger Bands (BB): The Bollinger Bands are narrowing, indicating decreasing volatility. The bands are currently close to the price, suggesting a potential breakout in either direction.
Volume Analysis:
- On-Balance Volume (OBV): The OBV has been relatively stable, indicating a balance between buying and selling pressure.
- Chaikin Money Flow (CMF): The CMF has shown an uptrend, indicating buying pressure in the market.
Key Observations:
- The trend indicators suggest a mixed outlook with potential for price volatility.
- Momentum indicators indicate a lack of strong momentum in either direction.
- Volatility is decreasing, signaling a potential consolidation phase.
- Volume indicators show a balance between buying and selling pressure.
Conclusion:
Based on the analysis of the technical indicators, the stock price of AEHL is likely to experience sideways movement in the coming days. The lack of strong momentum, decreasing volatility, and balanced volume suggest a period of consolidation. Traders may expect the stock to trade within a narrow range without a clear trend direction. It is advisable to closely monitor key support and resistance levels for potential breakout opportunities.