Technical Analysis of AEZS 2024-05-10
Overview:
In analyzing the technical indicators for AEZS over the last 5 days, we will delve into the trend, momentum, volatility, and volume indicators to provide a comprehensive outlook on the possible stock price movement in the coming days. By examining these key aspects, we aim to offer valuable insights and predictions for potential investors.
Trend Analysis:
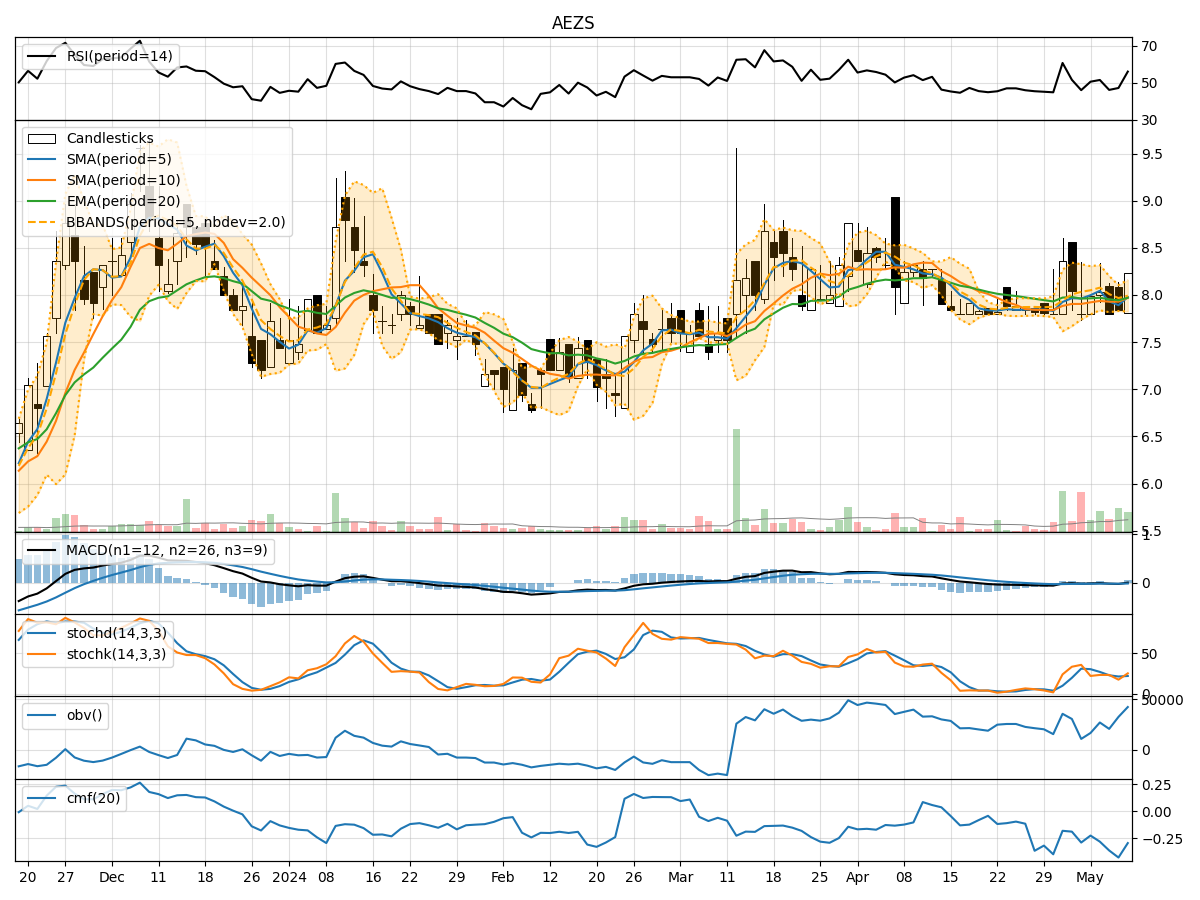
- Moving Averages (MA): The 5-day Moving Average (MA) has been fluctuating around the closing prices, indicating a lack of clear trend direction.
- MACD: The Moving Average Convergence Divergence (MACD) has shown negative values, suggesting a bearish momentum in the short term.
- EMA: The Exponential Moving Average (EMA) has been relatively stable but slightly declining, indicating a potential bearish sentiment.
Momentum Analysis:
- RSI: The Relative Strength Index (RSI) has been hovering around the neutral zone, indicating a lack of strong momentum in either direction.
- Stochastic Oscillator: Both %K and %D have been fluctuating, showing indecision in the market.
- Williams %R: The Williams %R is also fluctuating, reflecting uncertainty among traders.
Volatility Analysis:
- Bollinger Bands: The Bollinger Bands have shown narrowing bands, suggesting decreasing volatility in the stock price.
- Bollinger %B: The %B indicator has been fluctuating around the midline, indicating a lack of clear trend direction.
Volume Analysis:
- On-Balance Volume (OBV): The OBV has shown mixed movements, reflecting indecision among market participants.
- Chaikin Money Flow (CMF): The CMF has been negative, indicating selling pressure in the stock.
Key Observations:
- The trend indicators suggest a slightly bearish sentiment in the short term.
- Momentum indicators show a lack of strong momentum in either direction.
- Volatility has been decreasing, indicating a potential consolidation phase.
- Volume indicators reflect mixed movements, with a slight bias towards selling pressure.
Conclusion:
Based on the analysis of the technical indicators, the stock price of AEZS is likely to experience sideways movement in the coming days. The lack of clear trend direction, mixed momentum signals, decreasing volatility, and selling pressure indicated by volume indicators suggest a period of consolidation. Investors should exercise caution and closely monitor further developments before making any trading decisions.