Technical Analysis of AGMH 2024-05-10
Overview:
In analyzing the technical indicators for AGMH over the last 5 days, we will delve into the trend, momentum, volatility, and volume indicators to provide a comprehensive outlook on the possible stock price movement. By examining these key aspects, we aim to offer valuable insights and predictions for the upcoming trading days.
Trend Analysis:
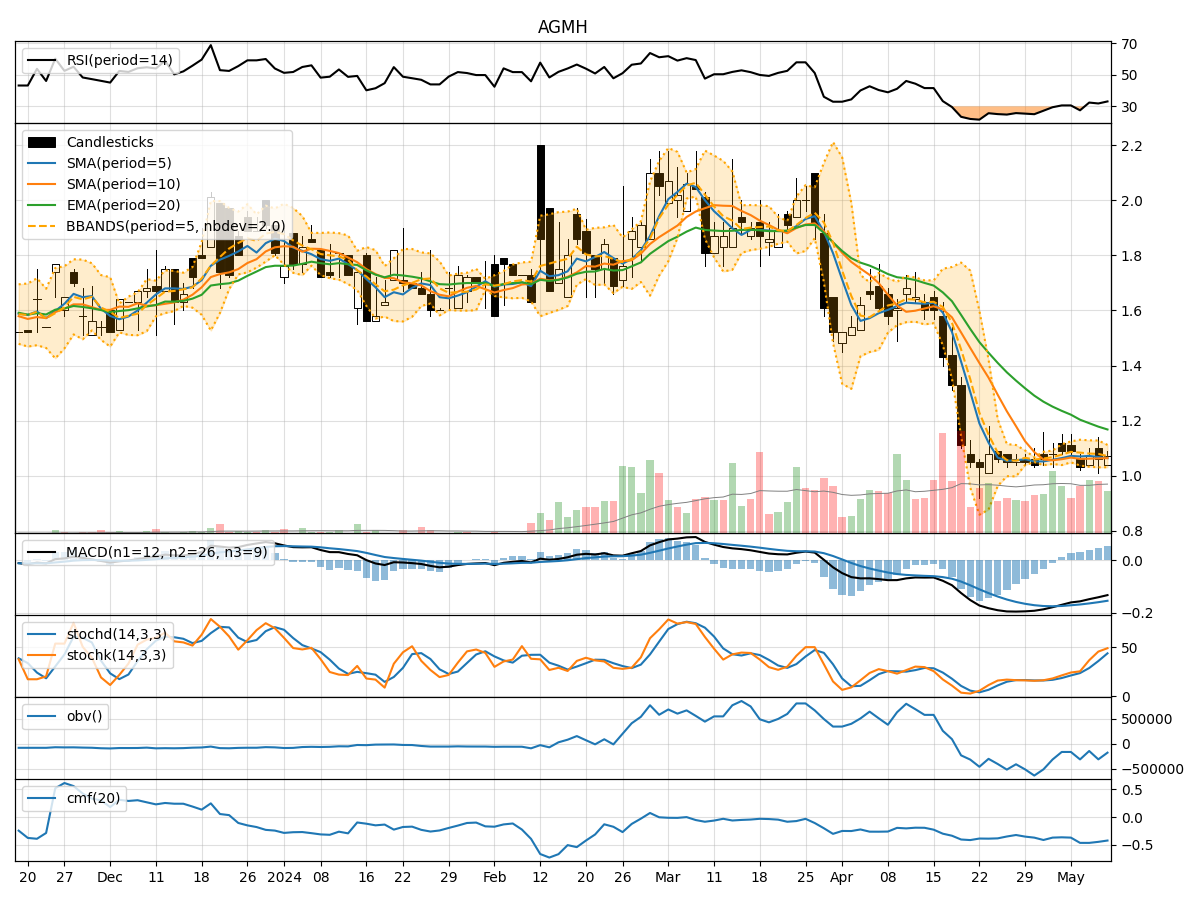
- Moving Averages (MA): The 5-day Moving Average (MA) has been relatively stable around 1.07, indicating a neutral trend in the short term.
- MACD: The Moving Average Convergence Divergence (MACD) shows a negative trend, with the MACD line consistently below the signal line, suggesting a bearish momentum.
- EMA: The Exponential Moving Average (EMA) has been declining over the past 5 days, further supporting the bearish sentiment in the short term.
Momentum Analysis:
- RSI: The Relative Strength Index (RSI) has been hovering around 30-33, indicating oversold conditions but not showing a clear signal for a reversal.
- Stochastic Oscillator: Both %K and %D lines of the Stochastic Oscillator have been rising, suggesting a potential bullish momentum building up.
- Williams %R: The Williams %R is in the oversold territory, indicating a possible reversal or consolidation phase.
Volatility Analysis:
- Bollinger Bands: The Bollinger Bands are narrowing, indicating decreasing volatility and a potential period of consolidation.
- Bollinger %B: The %B indicator is around 0.4-0.5, suggesting the stock is trading within the bands and not in extreme overbought or oversold conditions.
Volume Analysis:
- On-Balance Volume (OBV): The OBV has been fluctuating, showing no clear trend in volume accumulation or distribution.
- Chaikin Money Flow (CMF): The CMF has been negative, indicating selling pressure in the stock over the past few days.
Conclusion:
Based on the analysis of the technical indicators, the stock of AGMH is currently in a bearish phase with a potential for a short-term rebound. The trend indicators suggest a downward bias, supported by the MACD and EMA trends. However, the momentum indicators show signs of potential bullish momentum, especially with the Stochastic Oscillator pointing upwards.
Considering the volatility and volume indicators, the stock is likely to experience a period of consolidation or sideways movement in the near future. Traders should closely monitor the Stochastic Oscillator for a potential bullish crossover and the RSI for confirmation of a reversal.
In conclusion, while the overall trend remains bearish, there is a possibility of a short-term bullish reversal based on the momentum indicators. Traders should exercise caution and wait for confirmation signals before considering any long positions.