Technical Analysis of AGNC 2024-05-10
Overview:
In analyzing the technical indicators for AGNC over the last 5 days, we will delve into the trend, momentum, volatility, and volume indicators to provide a comprehensive outlook on the possible stock price movement in the coming days. By examining these key aspects, we aim to offer valuable insights and predictions for investors looking to make informed decisions.
Trend Analysis:
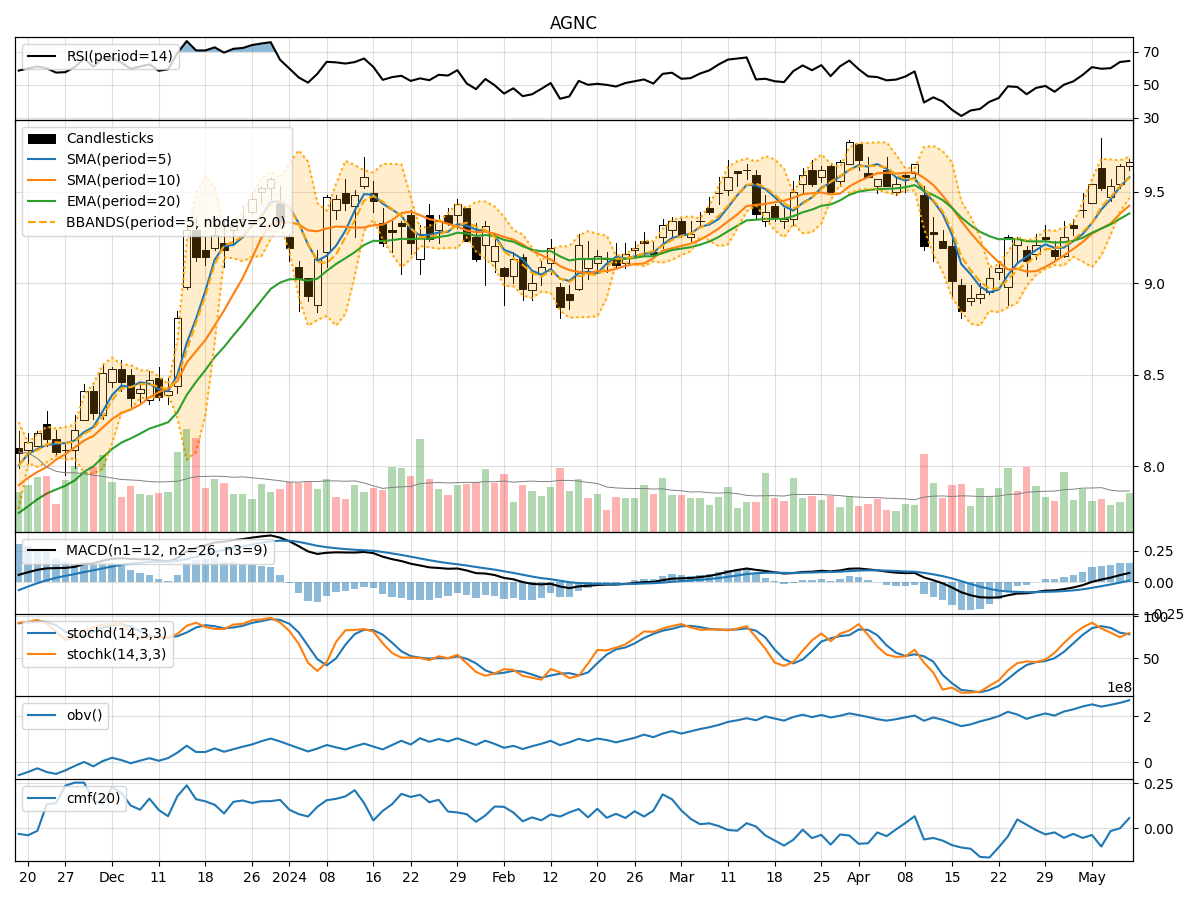
- Moving Averages (MA): The 5-day Moving Average (MA) has been consistently above the Simple Moving Average (SMA) and Exponential Moving Average (EMA), indicating a bullish trend.
- MACD: The MACD line has been consistently above the signal line, with both lines showing an upward trend, suggesting bullish momentum.
- MACD Histogram: The MACD Histogram has been increasing over the past 5 days, indicating strengthening bullish momentum.
Momentum Analysis:
- RSI: The Relative Strength Index (RSI) has been in the neutral to slightly overbought territory, suggesting a balanced momentum.
- Stochastic Oscillator: Both %K and %D have been fluctuating within the neutral zone, indicating indecision in momentum.
- Williams %R: The Williams %R has been hovering around oversold levels, signaling a potential reversal in momentum.
Volatility Analysis:
- Bollinger Bands: The stock price has been trading within the Bollinger Bands, with the bands narrowing over the last few days, indicating decreasing volatility.
- Bollinger %B: The %B indicator has been fluctuating around the middle band, suggesting a lack of clear direction in volatility.
Volume Analysis:
- On-Balance Volume (OBV): The OBV has shown a slight increase over the last 5 days, indicating a potential accumulation of the stock.
- Chaikin Money Flow (CMF): The CMF has been negative, suggesting a slight outflow of money from the stock.
Conclusion:
Based on the analysis of the technical indicators, the stock of AGNC is currently exhibiting a bullish trend with strong momentum and decreasing volatility. The volume indicators show a slight accumulation of the stock, albeit with some outflow of money indicated by the CMF.
Forecast:
Considering the overall bullish trend and momentum, along with decreasing volatility, it is likely that AGNC's stock price will continue to move upwards in the coming days. Investors may consider buying or holding their positions in anticipation of further price appreciation.
Disclaimer:
It is important to note that technical analysis is not a guaranteed predictor of future price movements, and other fundamental factors can influence stock prices. Investors should conduct thorough research and consider multiple indicators before making investment decisions. Consulting with a financial advisor is recommended for personalized investment advice.