Technical Analysis of AIP 2024-05-31
Overview:
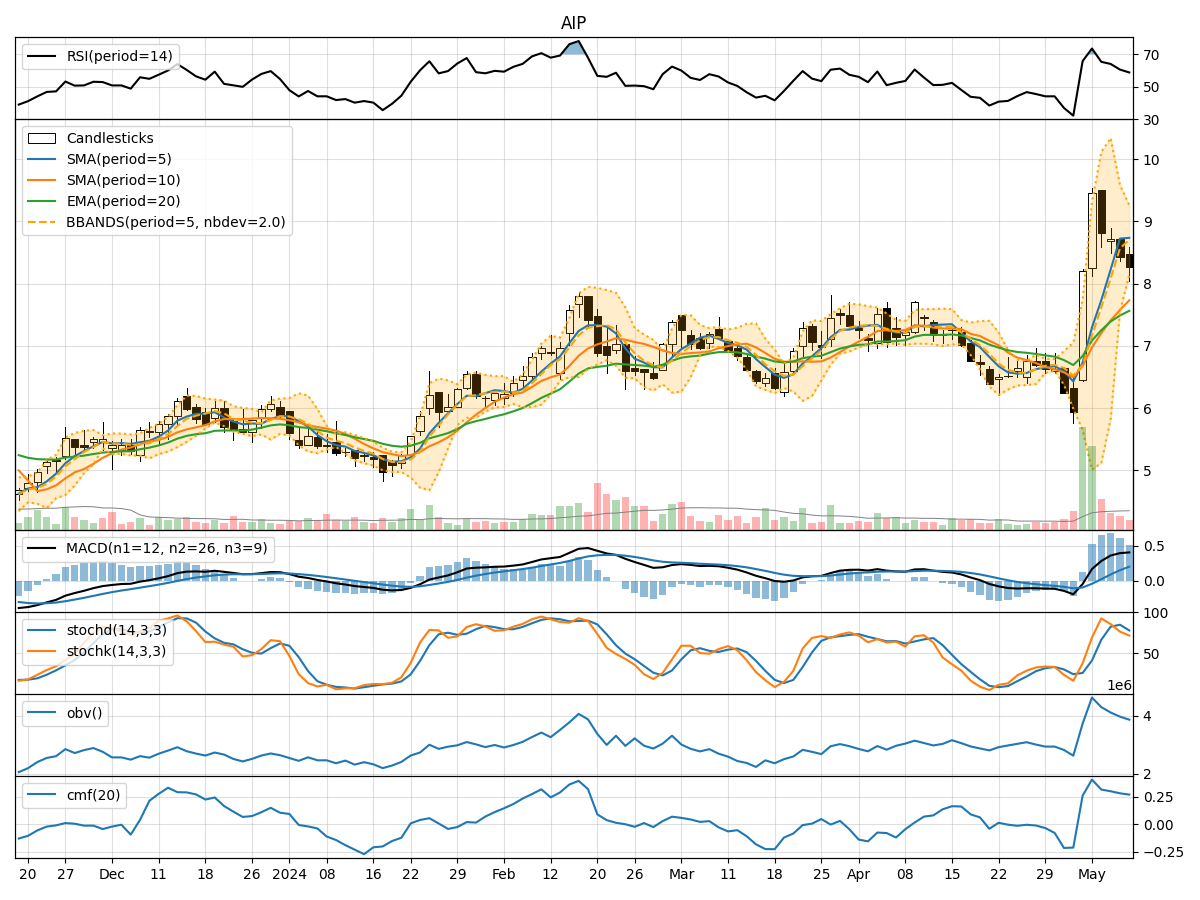
In analyzing the provided Technical Analysis (TA) data for the stock over the last 5 days, we will delve into the trend, momentum, volatility, and volume indicators to derive insights into the possible future stock price movement. By examining these key indicators, we aim to provide a comprehensive analysis and make informed predictions regarding the stock's potential direction in the upcoming days.
Trend Analysis:
- Moving Averages (MA): The 5-day Moving Average (MA) has been fluctuating around the closing prices, indicating a relatively stable trend.
- MACD: The Moving Average Convergence Divergence (MACD) has shown positive values, suggesting a bullish momentum in the short term.
- EMA: The Exponential Moving Average (EMA) has been gradually increasing, reflecting a positive trend in the stock price.
Key Observation: The trend indicators suggest a bullish sentiment in the stock price movement.
Momentum Analysis:
- RSI: The Relative Strength Index (RSI) has been hovering around the neutral zone, indicating a balanced momentum.
- Stochastic Oscillator: Both %K and %D values have shown mixed signals, with %K crossing %D, suggesting a potential reversal.
- Williams %R: The Williams %R is in the oversold region, indicating a possible buying opportunity.
Key Observation: The momentum indicators present a mixed outlook, with a slight inclination towards a bullish reversal.
Volatility Analysis:
- Bollinger Bands (BB): The Bollinger Bands have shown narrowing volatility, indicating a potential breakout or breakdown.
- Bollinger %B: The %B value has been fluctuating, suggesting uncertainty in price direction.
- Average True Range (ATR): The ATR has decreased, indicating reduced volatility in the stock.
Key Observation: Volatility indicators point towards a potential consolidation phase or a breakout in the stock price.
Volume Analysis:
- On-Balance Volume (OBV): The OBV has shown mixed volume accumulation, indicating indecision among investors.
- Chaikin Money Flow (CMF): The CMF has been gradually increasing, suggesting a positive inflow of money into the stock.
Key Observation: Volume indicators reflect a neutral stance with a slight bullish bias in terms of money flow.
Conclusion:
Based on the analysis of trend, momentum, volatility, and volume indicators, the stock is likely to experience sideways consolidation in the near term, with a potential bullish reversal indicated by the momentum indicators. The narrowing volatility and stable trend suggest a period of indecision among market participants, possibly leading to a breakout in the stock price.
Recommendation: Consider monitoring the stock closely for signs of a breakout above the resistance levels or a breakdown below the support levels to confirm the future price direction. Additionally, keep an eye on key economic events or market developments that could influence the stock's movement.