Technical Analysis of AIXI 2024-05-10
Overview:
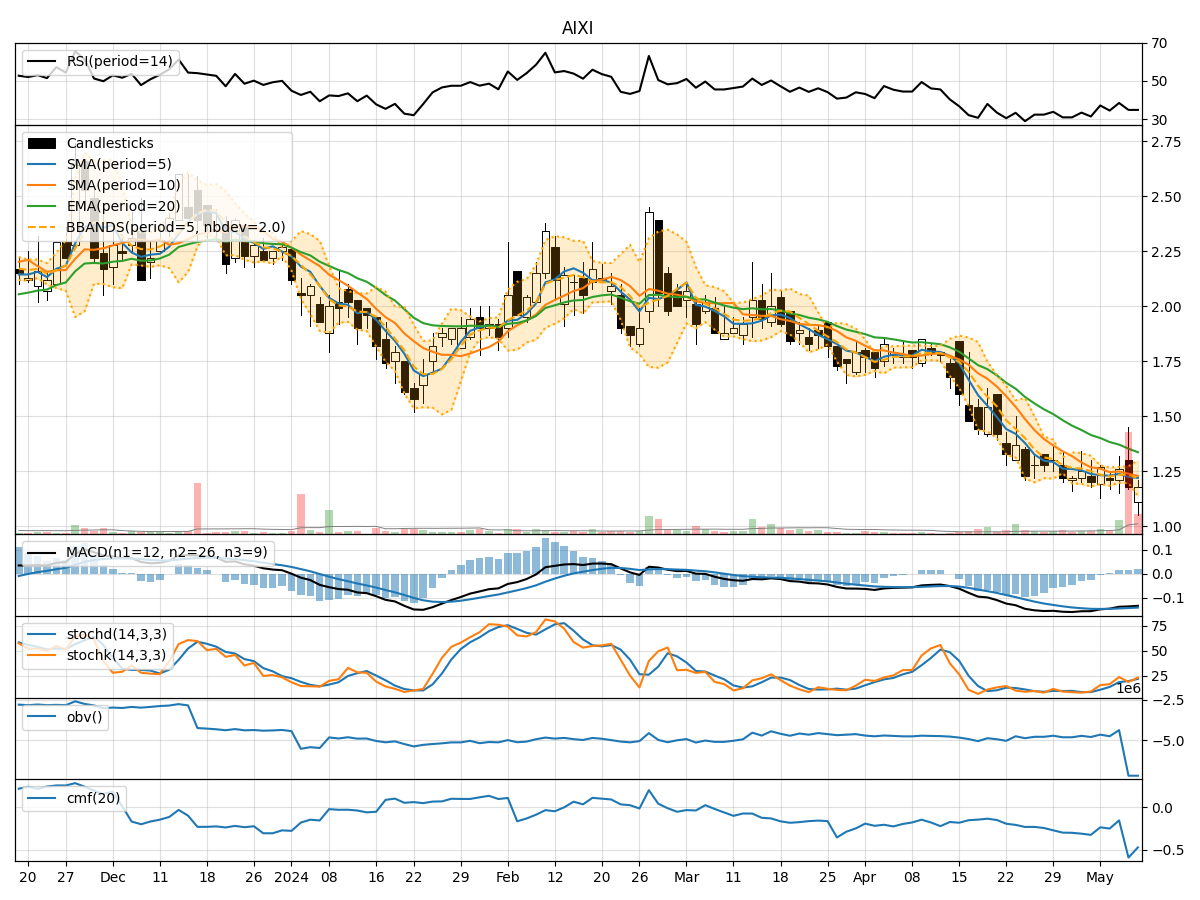
In the last 5 trading days, AIXI stock has shown mixed signals across various technical indicators. The stock price has been fluctuating within a certain range, indicating indecision in the market. We will analyze the trend, momentum, volatility, and volume indicators to determine the possible stock price movement in the next few days.
Trend Analysis:
- Moving Averages (MA): The 5-day Moving Average (MA) has been fluctuating around the 1.23-1.24 range, indicating a lack of clear trend direction.
- Exponential Moving Average (EMA): The EMA(20) has been steadily declining, suggesting a bearish trend in the medium term.
- Moving Average Convergence Divergence (MACD): The MACD line has been negative, indicating a bearish momentum in the short term.
Momentum Analysis:
- Relative Strength Index (RSI): The RSI has been hovering around the 30-40 range, indicating a neutral to slightly bearish momentum.
- Stochastic Oscillator: Both %K and %D lines have been fluctuating, showing indecision in momentum.
- Williams %R (WILLR): The Williams %R has been in oversold territory, suggesting a potential reversal in momentum.
Volatility Analysis:
- Bollinger Bands (BB): The Bollinger Bands have been narrowing, indicating decreasing volatility and a potential breakout in the near future.
Volume Analysis:
- On-Balance Volume (OBV): The OBV has been fluctuating, suggesting mixed buying and selling pressure.
- Chaikin Money Flow (CMF): The CMF has been negative, indicating a bearish money flow trend.
Key Observations:
- Trend: The stock is currently in a bearish trend based on the declining EMA and negative MACD.
- Momentum: Momentum indicators show mixed signals with a slight bearish bias.
- Volatility: Volatility is decreasing, signaling a potential period of consolidation.
- Volume: The volume indicators suggest a lack of strong buying or selling pressure.
Conclusion:
Based on the analysis of technical indicators, the next few days' possible stock price movement for AIXI is likely to be sideways with a slight bearish bias. Traders should watch for a potential breakout as the Bollinger Bands narrow, indicating a possible shift in volatility. It is advisable to wait for clearer signals before making significant trading decisions.