Technical Analysis of ALBT 2024-05-31
Overview:
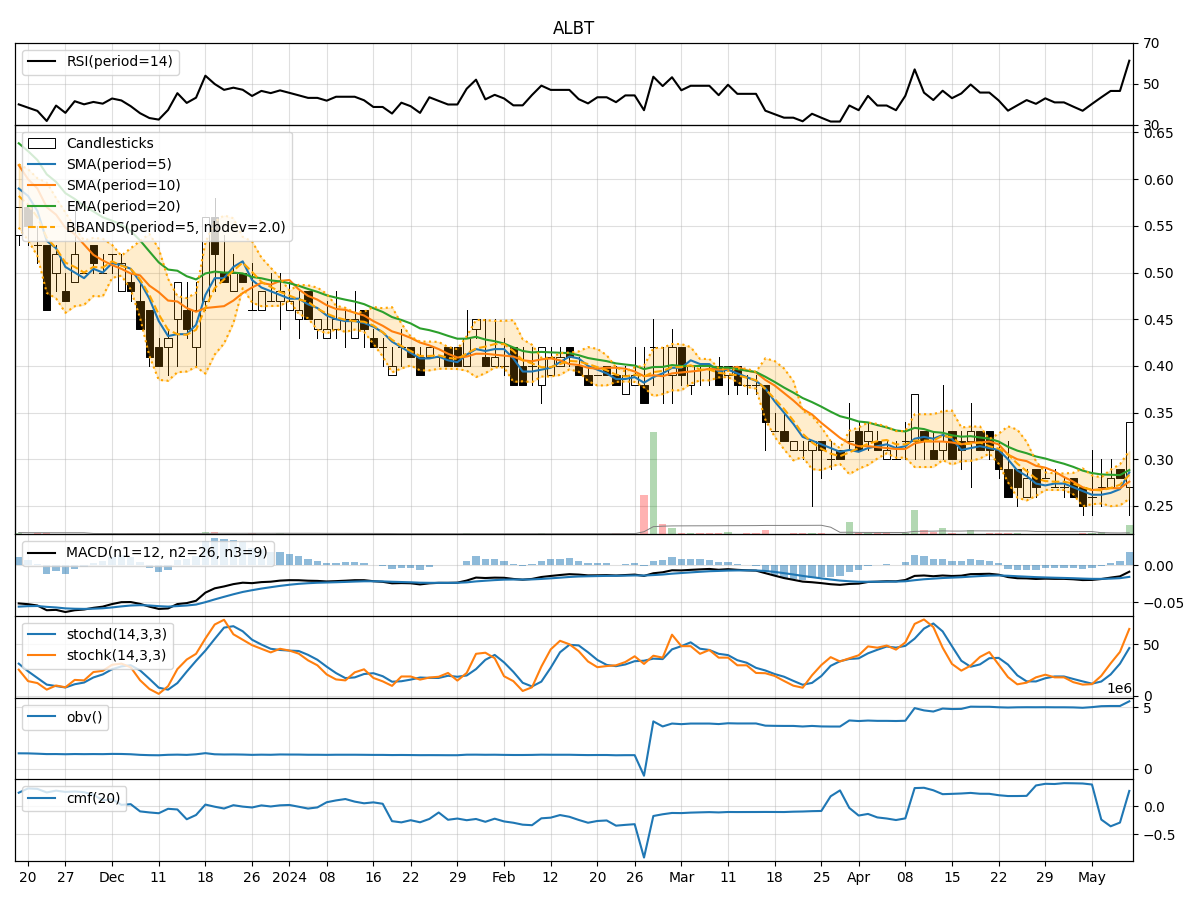
In analyzing the technical indicators for ALBT over the last 5 days, we will delve into the trend, momentum, volatility, and volume indicators to provide a comprehensive outlook on the possible stock price movement. By examining these key aspects, we aim to offer valuable insights and predictions for the upcoming days.
Trend Analysis:
- Moving Averages (MA): The 5-day moving average (MA) has been fluctuating around the closing prices, indicating short-term price trends. The Simple Moving Average (SMA) and Exponential Moving Average (EMA) show a slight upward trend, with the EMA slightly outperforming the SMA.
- MACD: The Moving Average Convergence Divergence (MACD) has been positive, suggesting bullish momentum in the stock price. The MACD Histogram (MACDH) has been consistently above the signal line, indicating strengthening bullish momentum.
Momentum Analysis:
- RSI: The Relative Strength Index (RSI) has been hovering around the neutral zone, indicating a balanced momentum between buying and selling pressure.
- Stochastic Oscillator: Both %K and %D of the Stochastic Oscillator have been in the oversold region, suggesting a potential reversal in the stock price.
- Williams %R: The Williams %R indicator has been in the oversold territory, signaling a possible buying opportunity.
Volatility Analysis:
- Bollinger Bands (BB): The Bollinger Bands have shown narrowing volatility, with the stock price approaching the lower band. This could indicate a potential reversal or consolidation phase.
- Bollinger %B: The %B indicator has been decreasing, reflecting a decrease in volatility and a possible period of consolidation.
Volume Analysis:
- On-Balance Volume (OBV): The OBV indicator has been fluctuating, indicating mixed buying and selling pressure in the stock.
- Chaikin Money Flow (CMF): The CMF has been negative, suggesting outflow of money from the stock over the analyzed period.
Conclusion:
Based on the technical indicators analyzed: - Trend: The stock is exhibiting a slightly bullish trend based on moving averages and MACD. - Momentum: The momentum indicators suggest a potential reversal or buying opportunity due to oversold conditions. - Volatility: Volatility is decreasing, indicating a possible consolidation phase. - Volume: Mixed signals from volume indicators imply uncertainty in market sentiment.
Overall View:
Considering the analysis of trend, momentum, volatility, and volume indicators, the next few days for ALBT could see sideways movement or consolidation with a slight bullish bias. Traders should closely monitor key support and resistance levels for potential entry or exit points. It is advisable to wait for clearer signals before making significant trading decisions.