Technical Analysis of ALEC 2024-05-10
Overview:
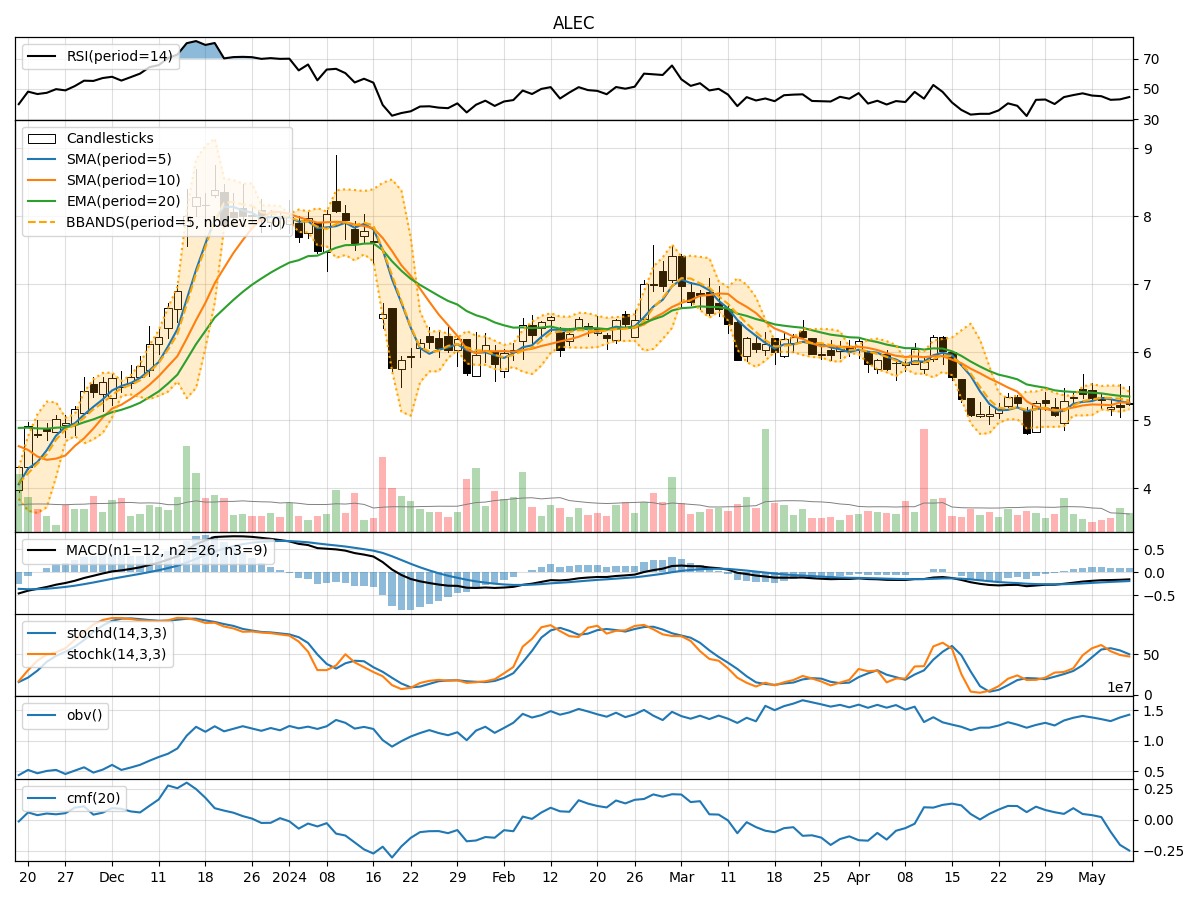
In analyzing the technical indicators for ALEC over the last 5 days, we will delve into the trend, momentum, volatility, and volume indicators to provide a comprehensive outlook on the possible stock price movement in the coming days.
Trend Analysis:
- Moving Averages (MA): The 5-day Moving Average (MA) has been fluctuating around the current stock price, indicating a lack of clear trend direction.
- MACD: The Moving Average Convergence Divergence (MACD) has been negative, suggesting a bearish momentum in the short term.
- EMA: The Exponential Moving Average (EMA) has been declining, further supporting the bearish sentiment in the stock.
Momentum Analysis:
- RSI: The Relative Strength Index (RSI) has been hovering around the neutral zone, indicating a lack of strong momentum either bullish or bearish.
- Stochastic Oscillator: Both %K and %D have been decreasing, signaling a potential bearish momentum.
- Williams %R: The Williams %R is in the oversold territory, suggesting a possible reversal or consolidation phase.
Volatility Analysis:
- Bollinger Bands (BB): The Bollinger Bands have been narrowing, indicating decreasing volatility in the stock.
- BB% (Bollinger Band %B): The %B has been fluctuating within a tight range, reflecting the consolidation phase.
- BB Width: The Bollinger Band Width has been decreasing, further confirming the low volatility environment.
Volume Analysis:
- On-Balance Volume (OBV): The OBV has been mixed, showing both accumulation and distribution phases in the stock.
- Chaikin Money Flow (CMF): The CMF has been negative, indicating selling pressure in the stock.
Key Observations:
- The stock is currently in a consolidation phase with no clear trend direction.
- Bearish momentum is evident from the MACD and Stochastic indicators.
- Volatility has been decreasing, suggesting a period of stability.
- Volume indicators show mixed signals with a slight bias towards selling pressure.
Conclusion:
Based on the analysis of the technical indicators, the stock is likely to experience further downward movement in the coming days. The bearish momentum, lack of clear trend direction, and negative volume indicators all point towards a potential continuation of the current downtrend. Traders and investors should exercise caution and consider short-term bearish strategies or wait for a clearer trend to emerge before making any significant trading decisions.