Technical Analysis of ALLT 2024-05-10
Overview:
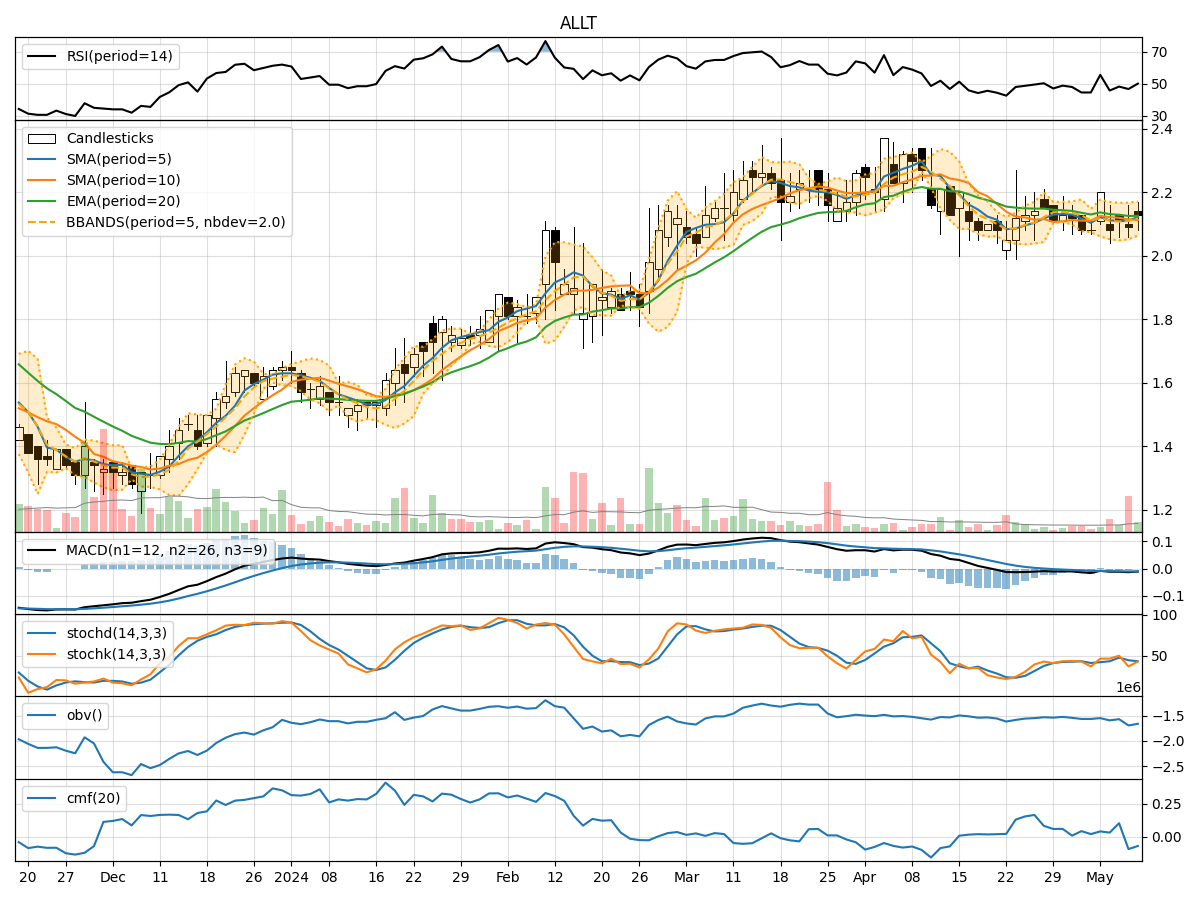
In analyzing the technical indicators for ALLT over the last 5 days, we will delve into the trend, momentum, volatility, and volume indicators to provide a comprehensive assessment of the stock's potential price movement. By examining these key factors, we aim to offer valuable insights and predictions for the next few days.
Trend Analysis:
- Moving Averages (MA): The 5-day Moving Average (MA) has been fluctuating around the current price, indicating a lack of clear trend direction.
- MACD: The Moving Average Convergence Divergence (MACD) has been consistently negative, suggesting a bearish momentum in the short term.
- EMA: The Exponential Moving Average (EMA) has been declining slightly, reflecting a weakening trend.
Key Observation: The trend indicators point towards a bearish sentiment in the short term.
Momentum Analysis:
- RSI: The Relative Strength Index (RSI) has been hovering around the neutral zone, indicating a lack of strong momentum.
- Stochastic Oscillator: Both %K and %D of the Stochastic Oscillator have been fluctuating, showing indecision in momentum.
- Williams %R: The Williams %R has been consistently in the oversold territory, suggesting a potential reversal.
Key Observation: Momentum indicators suggest a neutral to slightly bearish momentum outlook.
Volatility Analysis:
- Bollinger Bands (BB): The Bollinger Bands have been narrowing, indicating decreasing volatility.
- Bollinger %B: The %B indicator has been fluctuating within a tight range, reflecting stable volatility levels.
Key Observation: Volatility indicators signal a low volatility environment currently.
Volume Analysis:
- On-Balance Volume (OBV): The OBV has been fluctuating, indicating mixed buying and selling pressure.
- Chaikin Money Flow (CMF): The CMF has been oscillating around the zero line, suggesting a balance between buying and selling pressure.
Key Observation: Volume indicators show a neutral sentiment in terms of buying and selling pressure.
Conclusion:
Based on the analysis of the technical indicators, the next few days for ALLT are likely to see sideways movement with a slight bearish bias. The trend indicators point towards a bearish sentiment, while momentum indicators suggest a neutral to slightly bearish outlook. Volatility remains low, indicating a stable price environment, and volume indicators reflect a neutral stance in terms of buying and selling pressure.
Overall Assessment: The stock is expected to consolidate in the near term, with a potential for a slight downward movement. Traders may consider adopting a cautious approach and closely monitor key support and resistance levels for potential trading opportunities.