Technical Analysis of AMAL 2024-05-31
Overview:
In analyzing the technical indicators for AMAL over the last 5 days, we will delve into the trend, momentum, volatility, and volume indicators to provide a comprehensive outlook on the possible stock price movement. By examining these key indicators, we aim to offer valuable insights and predictions for the upcoming days.
Trend Analysis:
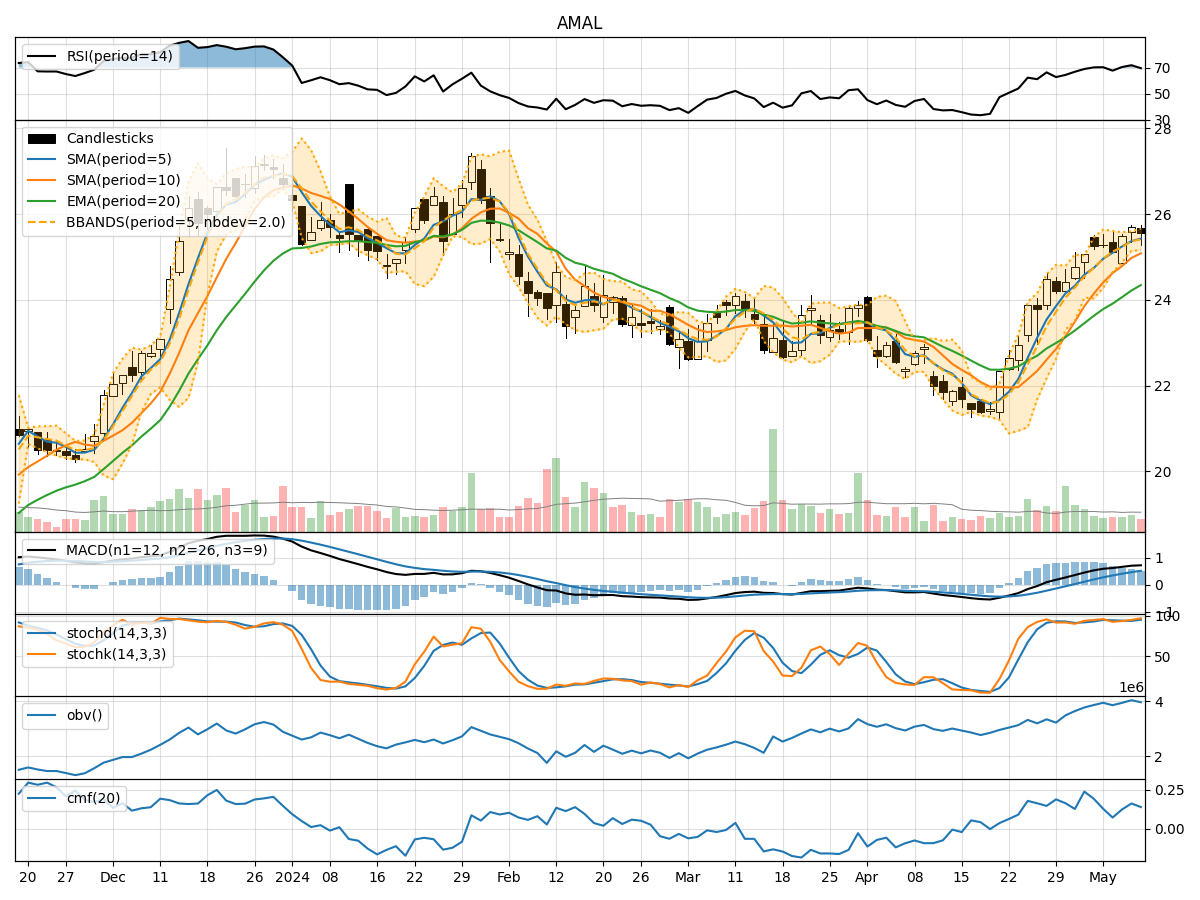
- Moving Averages (MA): The 5-day Moving Average (MA) has been gradually decreasing, indicating a short-term downtrend in the stock price.
- MACD: The MACD line has been consistently positive, suggesting bullish momentum in the stock.
- Relative Strength Index (RSI): The RSI has been fluctuating around the mid-level, indicating a neutral stance in terms of momentum.
Momentum Analysis:
- Stochastic Oscillator: The Stochastic Oscillator has shown mixed signals, with fluctuations in both the %K and %D values.
- Williams %R (WillR): The Williams %R has been hovering in the oversold territory, indicating a potential reversal in the stock price.
Volatility Analysis:
- Bollinger Bands (BB): The Bollinger Bands have been narrowing, suggesting a decrease in volatility and a possible period of consolidation.
- Bollinger %B (BBP): The %B indicator has been fluctuating within a range, indicating a lack of clear direction in price movement.
Volume Analysis:
- On-Balance Volume (OBV): The OBV indicator has been fluctuating, reflecting indecision among market participants.
- Chaikin Money Flow (CMF): The CMF has been negative, indicating selling pressure in the stock.
Key Observations:
- The trend indicators suggest a short-term downtrend, while momentum indicators show mixed signals.
- Volatility indicators point towards a period of consolidation and decreased volatility.
- Volume indicators reflect indecision and selling pressure in the market.
Conclusion:
Based on the analysis of the technical indicators, the stock of AMAL is likely to experience sideways movement in the upcoming days. The mixed signals from momentum indicators, coupled with decreasing volatility and selling pressure indicated by volume indicators, suggest a lack of clear direction in the stock price. Traders and investors should exercise caution and closely monitor further developments in the market before making any significant trading decisions.