Technical Analysis of AMRN 2024-05-10
Overview:
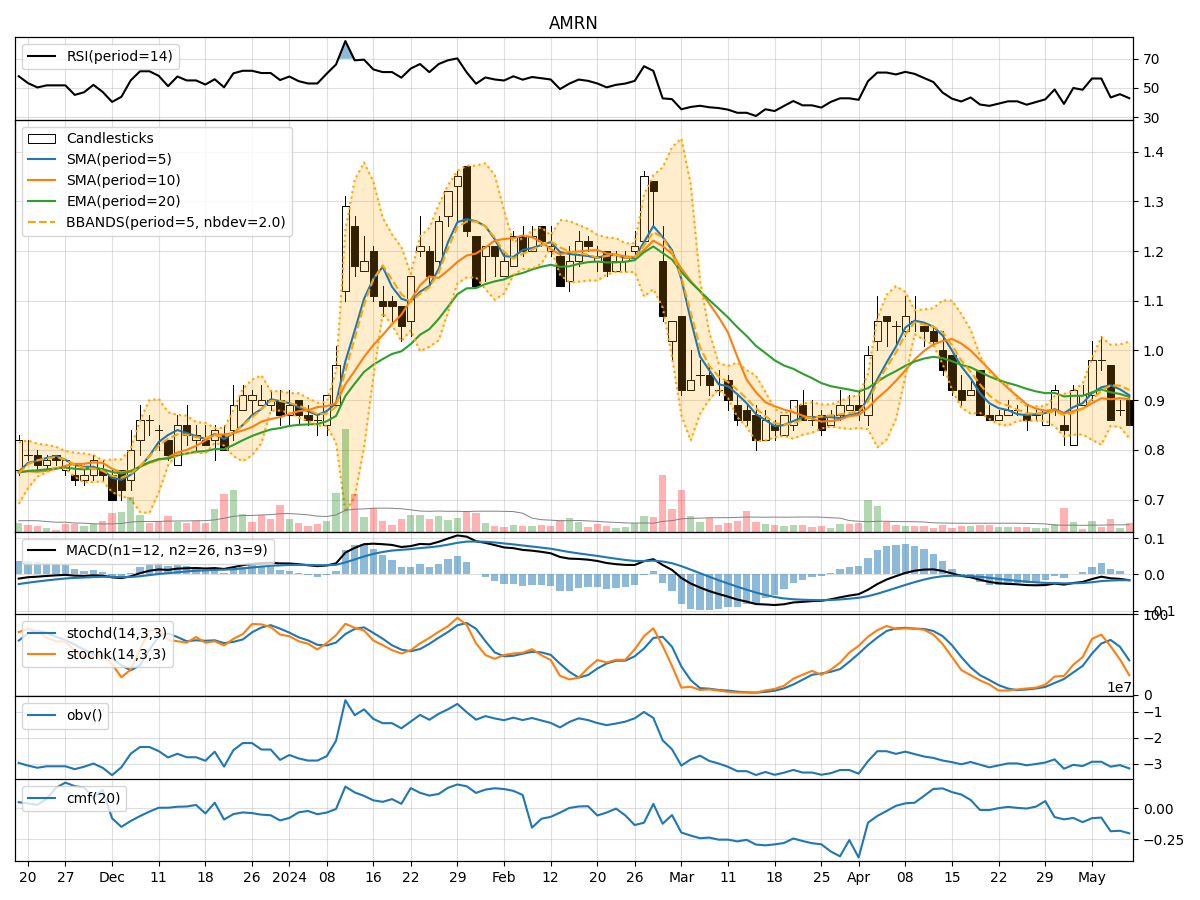
In analyzing the technical indicators for AMRN over the last 5 days, we will delve into the trend, momentum, volatility, and volume indicators to provide a comprehensive outlook on the possible stock price movement. By examining these key factors, we aim to offer valuable insights and predictions for the upcoming days.
Trend Analysis:
- Moving Averages (MA): The 5-day Moving Average (MA) has been declining, indicating a short-term bearish trend.
- MACD: The Moving Average Convergence Divergence (MACD) is negative, suggesting a bearish momentum.
- RSI: The Relative Strength Index (RSI) is below 50, reflecting a weakening trend.
Key Observation: The trend indicators point towards a bearish sentiment in the short term.
Momentum Analysis:
- Stochastic Oscillator: Both %K and %D are in oversold territory, signaling a potential reversal.
- Williams %R: The indicator is in oversold territory, indicating a possible buying opportunity.
Key Observation: Momentum indicators suggest a potential reversal or a temporary bounce in the stock price.
Volatility Analysis:
- Bollinger Bands (BB): The bands have widened, indicating increased volatility.
- Bollinger %B: The %B is below 0.2, suggesting the stock is oversold.
Key Observation: Volatility has increased, and the stock is nearing oversold levels.
Volume Analysis:
- On-Balance Volume (OBV): The OBV has been declining, indicating selling pressure.
- Chaikin Money Flow (CMF): The CMF is negative, reflecting a bearish money flow.
Key Observation: Volume indicators support the bearish sentiment in the market.
Conclusion:
Based on the analysis of the technical indicators, the next few days for AMRN are likely to see further downward movement in the stock price. The trend indicators, momentum indicators, and volume indicators all point towards a bearish outlook. While there may be a temporary bounce due to oversold conditions indicated by momentum indicators, the overall trend suggests a continuation of the current bearish sentiment.
Key Conclusion: The stock is expected to continue its downward trajectory in the near term.
As an expert TA analyst, it is crucial to monitor the indicators closely for any signs of a trend reversal or a shift in market sentiment. However, based on the current data and analysis, a bearish view is recommended for the next few days.