Technical Analysis of API 2024-05-10
Overview:
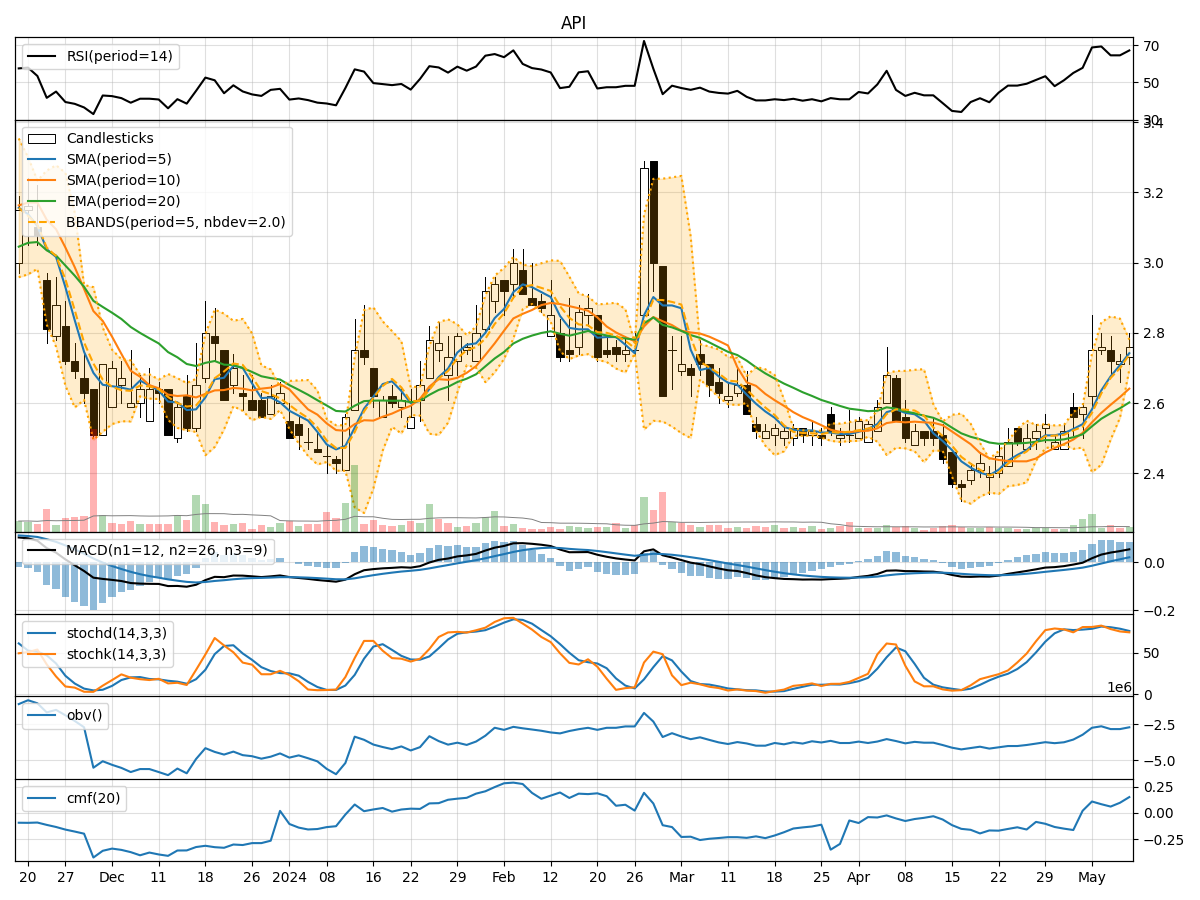
In the last 5 trading days, the stock has shown a mixed performance with fluctuations in price and volume. The technical indicators provide insights into the trend, momentum, volatility, and volume of the stock. By analyzing these indicators, we can make informed predictions about the possible future movement of the stock price.
Trend Analysis:
- Moving Averages (MA): The 5-day Moving Average (MA) has been trending upwards, indicating a positive short-term trend.
- MACD: The MACD line has been consistently above the signal line, suggesting bullish momentum.
- EMA: The Exponential Moving Average (EMA) has been steadily increasing, supporting the bullish trend.
Key Observation: The trend indicators point towards a bullish sentiment in the short term.
Momentum Analysis:
- RSI: The Relative Strength Index (RSI) has been fluctuating around the overbought territory, indicating strong buying pressure.
- Stochastic Oscillator: Both %K and %D have been in the overbought zone, suggesting a potential reversal.
- Williams %R: The Williams %R is in the oversold region, signaling a possible buying opportunity.
Key Observation: Momentum indicators show conflicting signals, with RSI indicating strength and Stochastic Oscillator hinting at a possible reversal.
Volatility Analysis:
- Bollinger Bands: The stock price has been trading within the Bollinger Bands, indicating normal volatility.
- Bollinger %B: The %B indicator is hovering around the middle, suggesting balanced volatility.
- Average True Range (ATR): The ATR value has been relatively stable, indicating consistent volatility levels.
Key Observation: Volatility indicators suggest a stable price movement with no extreme fluctuations.
Volume Analysis:
- On-Balance Volume (OBV): The OBV has shown mixed signals, with some days recording higher volume accumulation.
- Chaikin Money Flow (CMF): The CMF has been positive, indicating buying pressure in the market.
Key Observation: Volume indicators reflect mixed sentiment, with OBV showing inconsistency and CMF signaling buying interest.
Conclusion:
Based on the analysis of technical indicators, the stock is likely to experience further upward movement in the next few days. The bullish trend indicated by moving averages and MACD, coupled with strong buying pressure highlighted by RSI, suggests a positive outlook. However, caution is advised due to conflicting signals from the Stochastic Oscillator. Overall, the stock is expected to continue its upward trajectory in the short term.
Key Conclusion: Bullish sentiment with a potential for upward movement in the next few days.