Technical Analysis of APLS 2024-05-10
Overview:
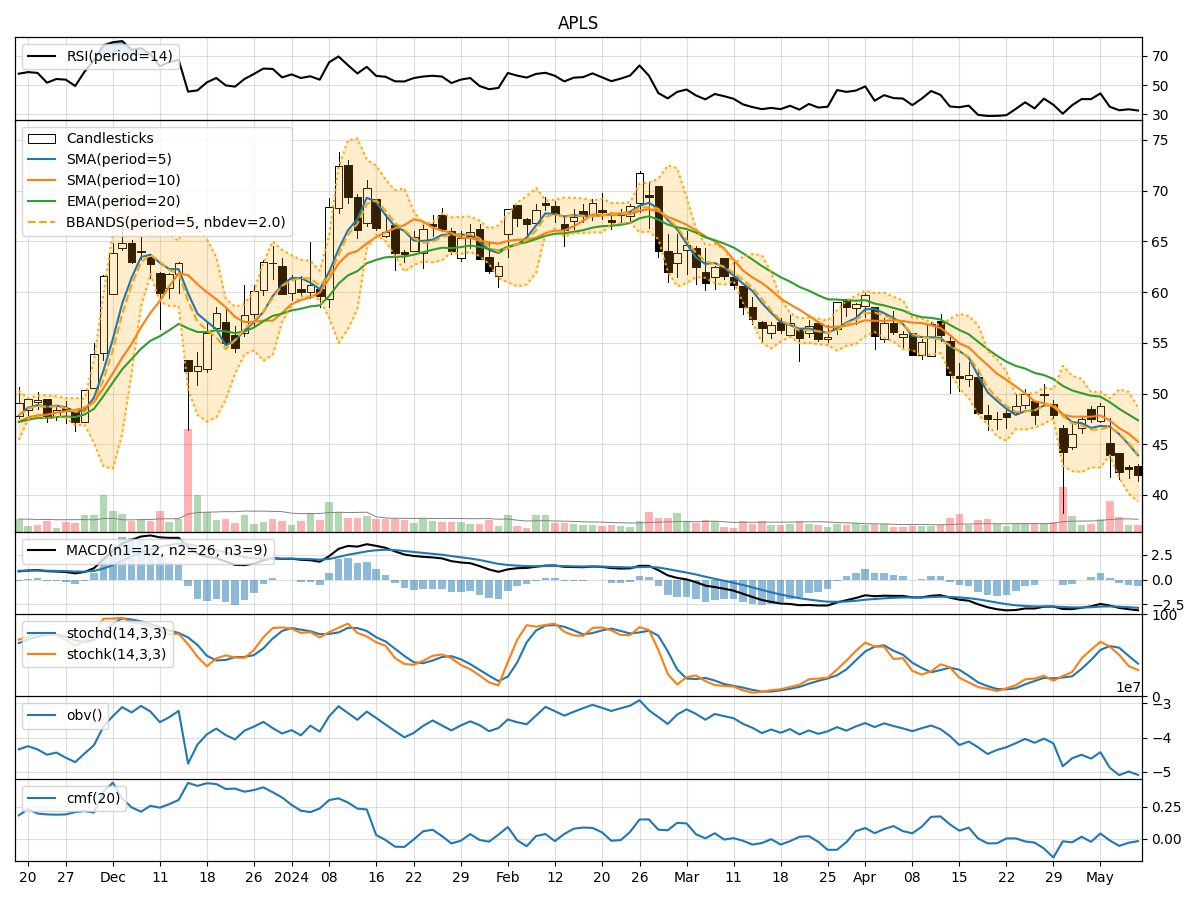
In analyzing the technical indicators for APLS over the last 5 days, we will delve into the trend, momentum, volatility, and volume indicators to provide a comprehensive outlook on the possible stock price movement in the coming days.
Trend Analysis:
- Moving Averages (MA): The 5-day MA has been consistently decreasing, indicating a downward trend in the stock price.
- MACD: The MACD line has been consistently below the signal line, suggesting a bearish momentum in the stock.
- EMA: The EMA has also been trending downwards, further confirming the bearish sentiment in the stock.
Momentum Analysis:
- RSI: The RSI has been decreasing, indicating a weakening momentum in the stock.
- Stochastic Oscillator: Both %K and %D have been declining, signaling a bearish momentum.
- Williams %R: The indicator has been in oversold territory, suggesting a potential reversal or continuation of the downtrend.
Volatility Analysis:
- Bollinger Bands: The stock price has been consistently below the lower Bollinger Band, indicating oversold conditions.
- Bollinger %B: The %B has been below 0.2, suggesting a potential bounce back in the stock price.
- Bollinger Band Width: The Band Width has been narrowing, indicating decreasing volatility.
Volume Analysis:
- On-Balance Volume (OBV): The OBV has been declining, indicating selling pressure in the stock.
- Chaikin Money Flow (CMF): The CMF has been negative, suggesting outflow of money from the stock.
Key Observations:
- The stock is currently in a strong bearish trend based on the moving averages, MACD, and EMA indicators.
- Momentum indicators such as RSI and Stochastic Oscillator also confirm the bearish sentiment in the stock.
- Volatility indicators show that the stock is in oversold territory, which could potentially lead to a reversal.
- The volume indicators reflect selling pressure and a negative money flow in the stock.
Conclusion:
Based on the analysis of the technical indicators, the next few days are likely to see a continuation of the downward trend in the stock price. The bearish momentum is strong, supported by multiple indicators pointing towards further downside potential. Traders and investors should exercise caution and consider waiting for signs of a reversal before considering any long positions.