Technical Analysis of APPF 2024-05-10
Overview:
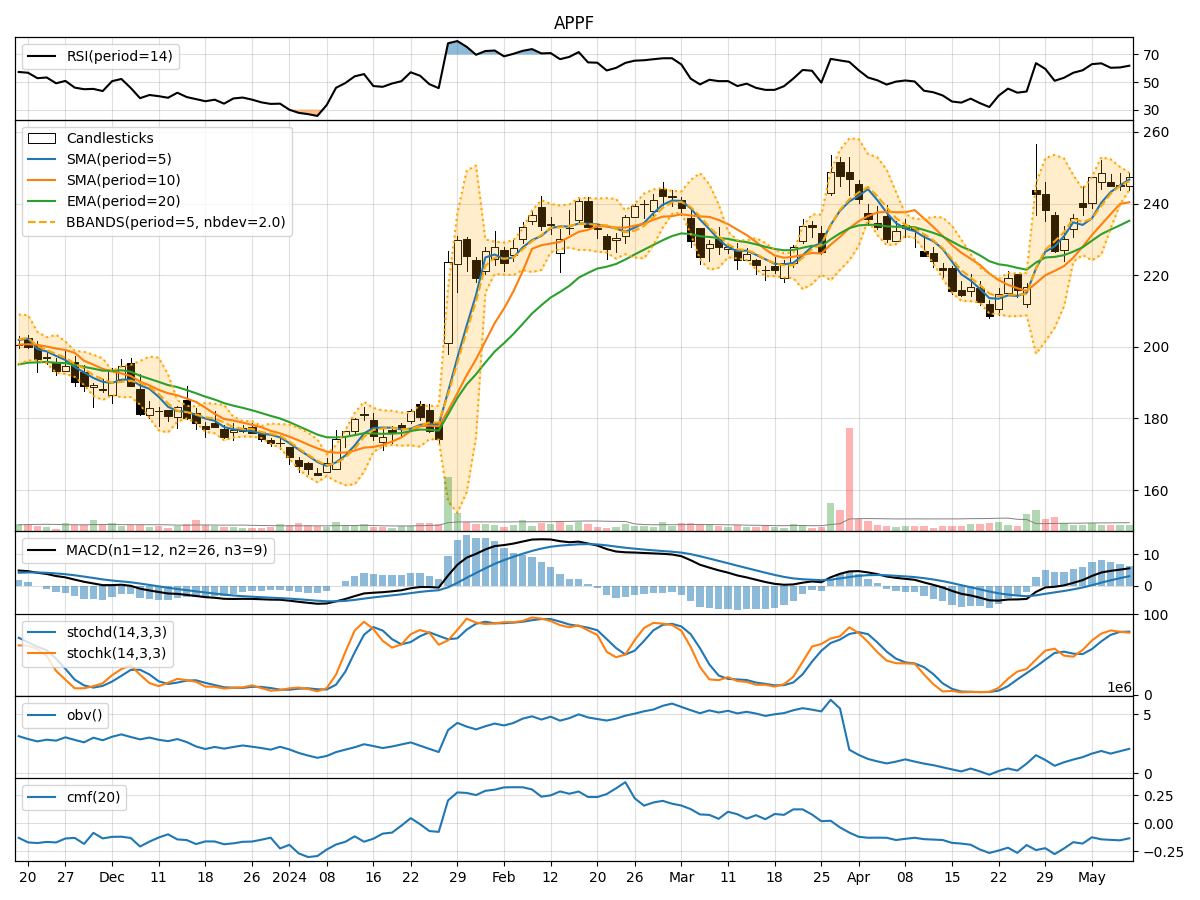
In analyzing the technical indicators for APPF over the last 5 days, we will delve into the trend, momentum, volatility, and volume indicators to provide a comprehensive outlook on the possible stock price movement in the coming days.
Trend Indicators:
- Moving Averages (MA): The 5-day MA has been consistently above the longer-term SMAs and EMAs, indicating a bullish trend.
- MACD: The MACD line has been consistently above the signal line, with increasing values, suggesting strong bullish momentum.
- MACD Histogram: The histogram has been rising, indicating an uptrend gaining strength.
Momentum Indicators:
- RSI: The RSI has been in the neutral to slightly overbought territory, suggesting a balanced momentum.
- Stochastic Oscillator: Both %K and %D have been in the overbought zone, indicating a potential reversal.
- Williams %R: The indicator has been hovering around the oversold region, signaling a possible buying opportunity.
Volatility Indicators:
- Bollinger Bands: The bands have been narrowing, indicating decreasing volatility and a potential breakout.
- Bollinger %B: The %B has been fluctuating within a range, suggesting consolidation.
Volume Indicators:
- On-Balance Volume (OBV): The OBV has been declining, indicating selling pressure.
- Chaikin Money Flow (CMF): The CMF has been negative, reflecting a lack of buying interest.
Key Observations and Opinions:
- Trend: The trend indicators suggest a strong bullish sentiment in the short term.
- Momentum: Mixed signals from momentum indicators indicate a potential reversal or consolidation.
- Volatility: Decreasing volatility points towards a possible period of consolidation.
- Volume: Declining OBV and negative CMF indicate a lack of strong buying interest.
Conclusion:
Based on the analysis of the technical indicators, the next few days for APPF could see sideways movement or a slight pullback in the stock price. The bullish trend may face some resistance due to overbought conditions in momentum indicators and decreasing buying interest reflected in volume indicators. Traders should exercise caution and consider waiting for clearer signals before making significant trading decisions.