Technical Analysis of ARCC 2024-05-10
Overview:
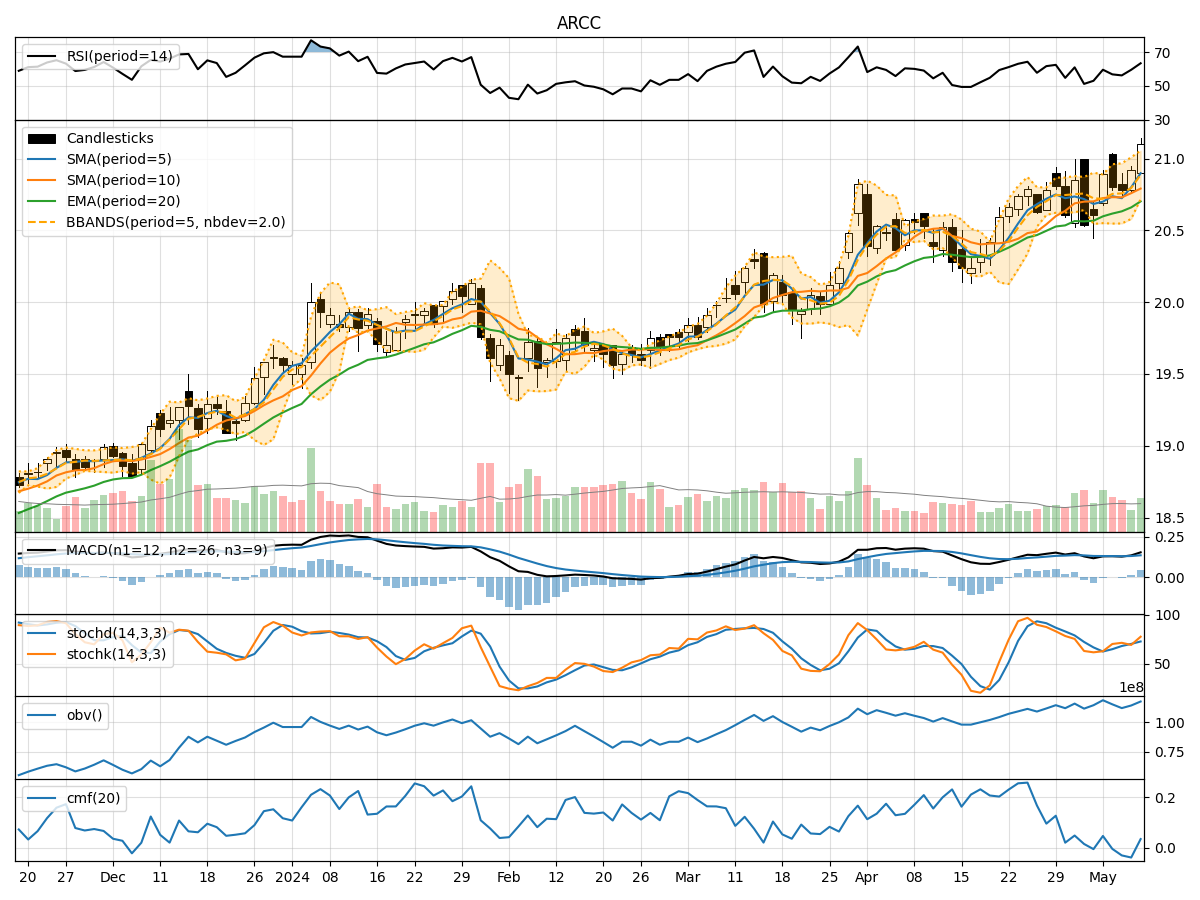
In analyzing the technical indicators for ARCC over the last 5 days, we will delve into the trend, momentum, volatility, and volume indicators to provide a comprehensive outlook on the possible stock price movement in the coming days.
Trend Analysis:
- Moving Averages (MA): The 5-day Moving Average (MA) has been trending above the Simple Moving Average (SMA) and Exponential Moving Average (EMA), indicating a short-term bullish trend.
- MACD: The MACD line has been consistently above the signal line, with both lines showing an upward trend, suggesting bullish momentum.
- Conclusion: The trend indicators point towards an upward trend in the stock price.
Momentum Analysis:
- RSI: The Relative Strength Index (RSI) has been fluctuating around the 60-70 range, indicating moderate bullish momentum.
- Stochastic Oscillator: Both %K and %D lines of the Stochastic Oscillator have been in the overbought zone, suggesting a potential reversal.
- Conclusion: Momentum indicators suggest a neutral to slightly bearish momentum in the stock price.
Volatility Analysis:
- Bollinger Bands (BB): The stock price has been trading within the Bollinger Bands, with the bands widening slightly, indicating increased volatility.
- Conclusion: Volatility indicators signal increased volatility in the stock price.
Volume Analysis:
- On-Balance Volume (OBV): The OBV has shown mixed movements, indicating indecision among investors.
- Chaikin Money Flow (CMF): The CMF has been fluctuating around the zero line, suggesting a balance between buying and selling pressure.
- Conclusion: Volume indicators reflect indecisiveness in the stock price direction.
Key Observations:
- Trend: The trend indicators suggest an upward trend.
- Momentum: Momentum indicators indicate a neutral to slightly bearish momentum.
- Volatility: Volatility indicators point towards increased volatility.
- Volume: Volume indicators reflect indecisiveness among investors.
Conclusion:
Based on the analysis of the technical indicators, the next few days' possible stock price movement for ARCC is likely to be sideways with a slight upward bias. The trend indicators support a bullish view, while momentum indicators suggest a neutral to slightly bearish outlook. Increased volatility may lead to fluctuations in the stock price, while indecisiveness among investors, as reflected in volume indicators, could limit significant price movements.
Recommendation:
Considering the mixed signals from the technical indicators, it is advisable for investors to closely monitor the stock price movement and wait for clearer signals before making significant trading decisions. It is essential to exercise caution and consider implementing risk management strategies to navigate the potential volatility in the market.