Technical Analysis of ASCB 2024-05-10
Overview:
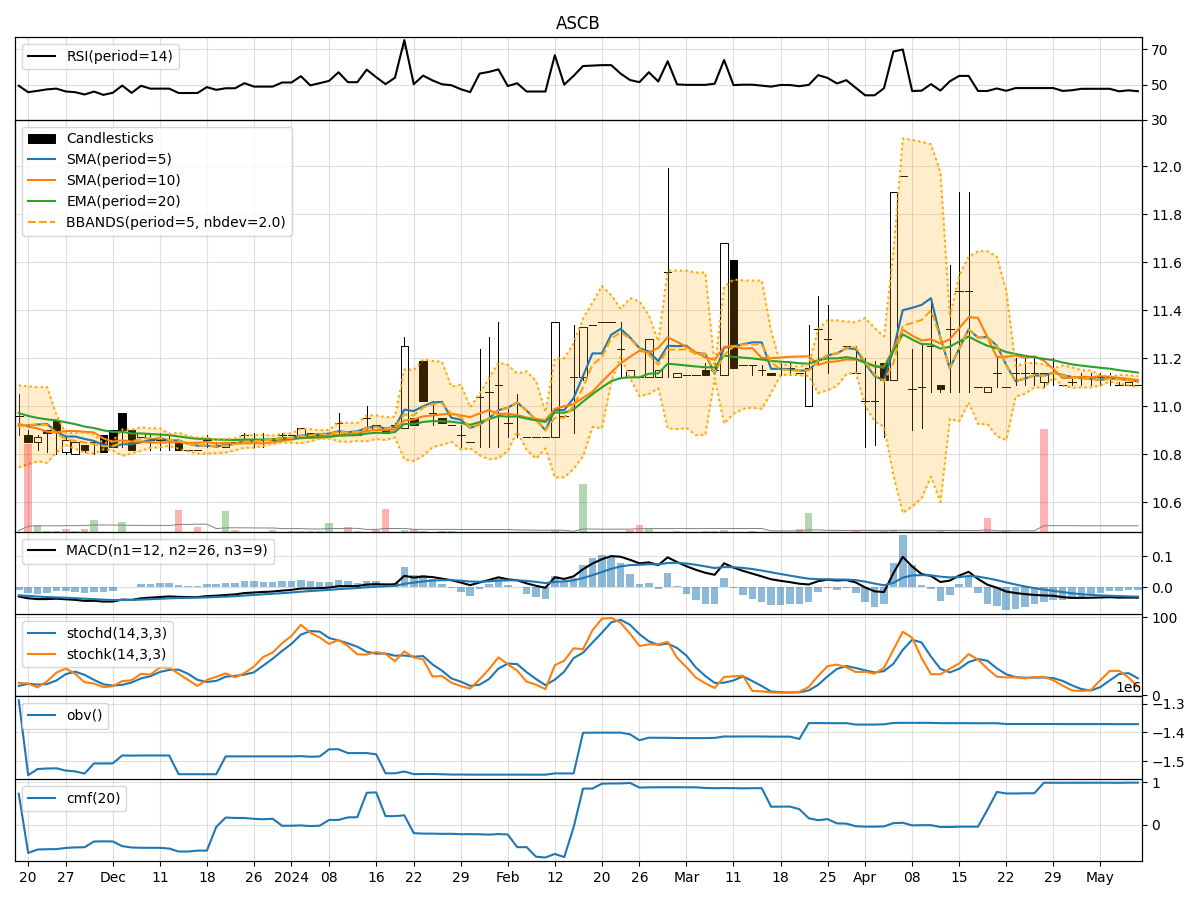
In analyzing the technical indicators for ASCB stock over the last 5 days, we will delve into the trends, momentum, volatility, and volume indicators to provide a comprehensive outlook on the possible future stock price movement. By examining these key indicators, we aim to offer valuable insights and predictions for the upcoming trading days.
Trend Indicators:
- Moving Averages (MA): The 5-day Moving Average has been hovering around the current stock price, indicating a relatively stable trend.
- MACD: The Moving Average Convergence Divergence shows a negative trend, with the MACD line consistently below the signal line.
- EMA: The Exponential Moving Average has been gradually decreasing, suggesting a bearish sentiment in the short term.
Momentum Indicators:
- RSI: The Relative Strength Index is in the neutral zone, indicating a balanced momentum in the stock.
- Stochastic Oscillator: Both %K and %D values are relatively low, signaling a potential oversold condition.
- Williams %R: The Williams %R is in the oversold territory, indicating a possible reversal in the stock price.
Volatility Indicators:
- Bollinger Bands: The Bollinger Bands are narrowing, suggesting a decrease in volatility and a potential upcoming breakout.
- Bollinger %B: The %B indicator is below 0.5, indicating a possible oversold condition in the stock.
Volume Indicators:
- On-Balance Volume (OBV): The OBV has been relatively stable, indicating a balance between buying and selling pressure.
- Chaikin Money Flow (CMF): The CMF is positive, suggesting that money is flowing into the stock.
Key Observations and Opinions:
- Trend: The trend indicators show a bearish sentiment in the short term, with the MACD and EMA pointing downwards.
- Momentum: The momentum indicators suggest a potential reversal in the stock price, as the Williams %R is in the oversold territory.
- Volatility: The narrowing Bollinger Bands indicate a potential breakout, while the %B being below 0.5 signals an oversold condition.
- Volume: The volume indicators show a balanced buying and selling pressure, with money flowing into the stock according to the CMF.
Conclusion:
Based on the analysis of the technical indicators, the stock price of ASCB is likely to experience a short-term downward movement in the next few days. The bearish trend indicated by the MACD and EMA, coupled with the oversold conditions highlighted by the momentum indicators, suggest a potential correction or consolidation phase. Traders should exercise caution and consider waiting for a clearer signal before making any significant trading decisions.