Technical Analysis of ATLX 2024-05-10
Overview:
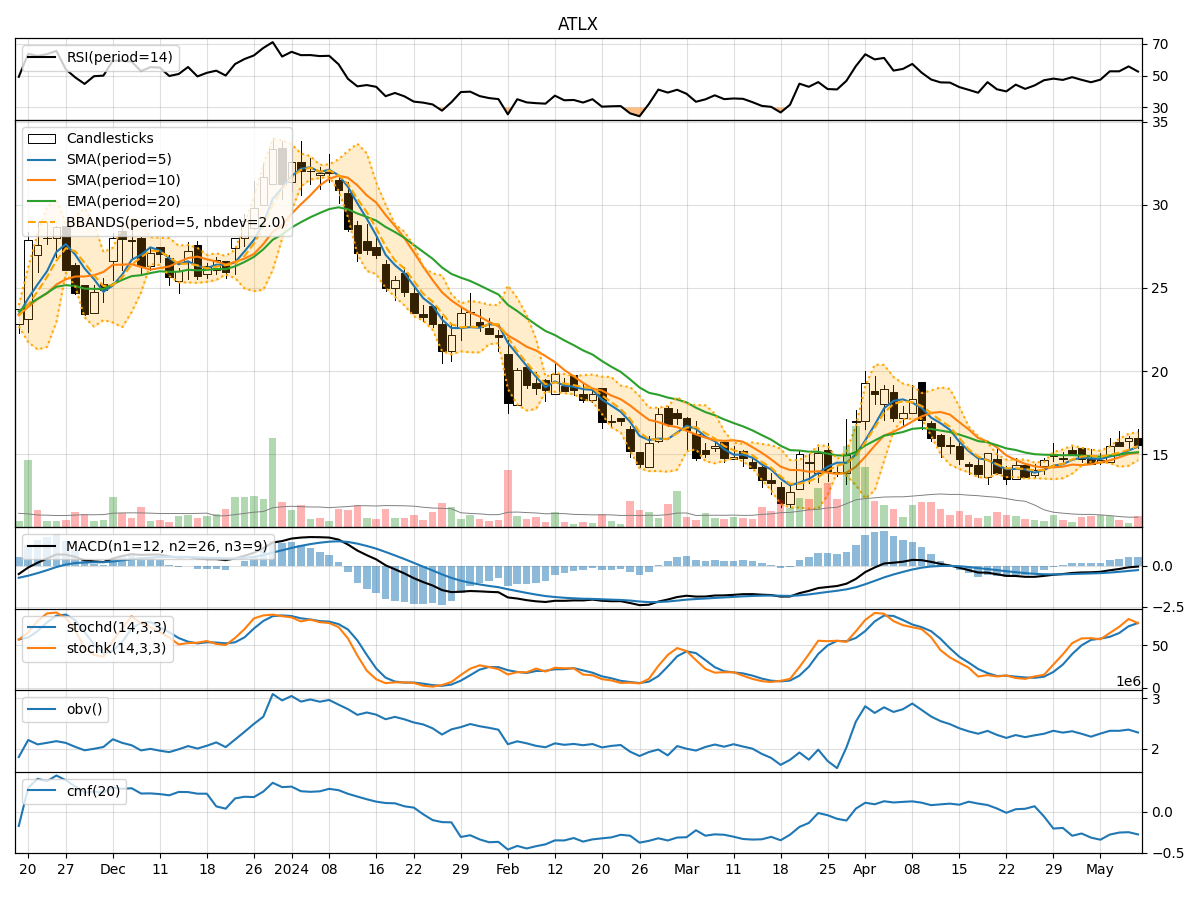
In the last 5 trading days, ATLX stock has shown mixed signals across various technical indicators. The stock price has fluctuated within a range, with some indicators suggesting potential bullish momentum while others indicating a possible consolidation phase. By analyzing trend, momentum, volatility, and volume indicators, we can gain a comprehensive understanding of the stock's potential future price movement.
Trend Indicators:
- Moving averages (MA) show a slight uptrend, with the 5-day MA consistently above the 10-day simple moving average (SMA).
- Exponential moving average (EMA) has been gradually increasing, indicating a positive trend.
- MACD line has been below the signal line but showing signs of convergence, suggesting a potential bullish crossover in the near future.
Momentum Indicators:
- Relative Strength Index (RSI) has been fluctuating around the neutral zone, indicating indecision in the market.
- Stochastic oscillators have been in the overbought territory, suggesting a possible reversal or consolidation.
- Williams %R (WILLR) is in the oversold region, indicating a potential buying opportunity.
Volatility Indicators:
- Bollinger Bands (BB) are narrowing, indicating decreasing volatility and a possible period of consolidation.
- Bollinger Band %B (BBP) is below 1, suggesting the stock is trading below the lower band, potentially oversold.
Volume Indicators:
- On-Balance Volume (OBV) has been relatively flat, indicating a balance between buying and selling pressure.
- Chaikin Money Flow (CMF) is negative, suggesting outflow of money from the stock.
Key Observations:
- Trend: The stock is in a mild uptrend, supported by the EMA and MA indicators.
- Momentum: Mixed signals with RSI neutral, stochastic overbought, and WILLR oversold.
- Volatility: Decreasing volatility and BBP below 1 indicate a potential consolidation phase.
- Volume: Lack of significant volume movements suggests a lack of strong buying or selling pressure.
Conclusion:
Based on the analysis of technical indicators, the next few days for ATLX stock are likely to see sideways movement or consolidation. The stock may trade within a narrow range as it digests recent price movements. Traders should exercise caution and wait for clearer signals before taking significant positions.