Technical Analysis of AUR 2024-05-10
Overview:
In analyzing the technical indicators for AUR stock over the last 5 days, we will delve into the trend, momentum, volatility, and volume indicators to provide a comprehensive outlook on the possible stock price movement in the coming days. By examining these key indicators, we aim to offer valuable insights and predictions for potential investors.
Trend Analysis:
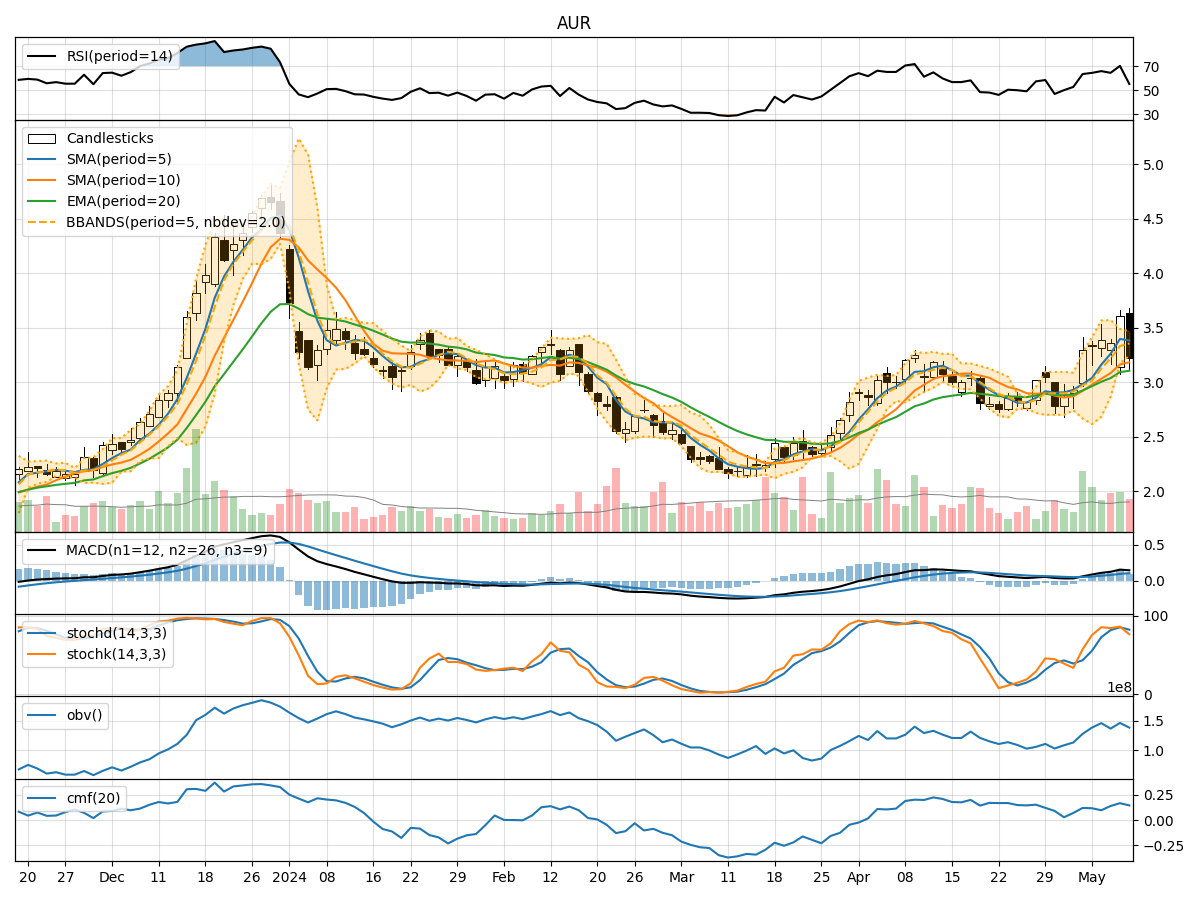
- Moving Averages (MA): The moving averages show an increasing trend in the stock price over the last 5 days, with the 5-day moving average consistently above the longer-term moving averages (SMA and EMA). This indicates a bullish trend in the short term.
- MACD: The MACD line has been consistently above the signal line, suggesting positive momentum in the stock price.
- MACD Histogram: The MACD histogram has been increasing, indicating strengthening bullish momentum.
Momentum Analysis:
- RSI: The Relative Strength Index (RSI) has been fluctuating but generally staying within the neutral range, suggesting a balanced momentum in the stock.
- Stochastic Oscillator: The Stochastic indicators have been relatively high, indicating that the stock may have been overbought in the short term.
- Williams %R: The Williams %R is showing oversold conditions on the last trading day, indicating a potential reversal in the stock price.
Volatility Analysis:
- Bollinger Bands: The Bollinger Bands have been widening, indicating increased volatility in the stock price.
- Bollinger %B: The %B indicator has been fluctuating within a wide range, suggesting potential price reversals or breakouts.
Volume Analysis:
- On-Balance Volume (OBV): The OBV has been fluctuating, indicating mixed buying and selling pressure in the stock.
- Chaikin Money Flow (CMF): The CMF has been positive, suggesting that money is flowing into the stock over the last 20 days.
Key Observations:
- The trend indicators suggest a bullish sentiment in the short term.
- Momentum indicators show mixed signals with potential for a reversal.
- Volatility has increased, indicating potential price swings.
- Volume indicators reflect mixed buying and selling pressure.
Conclusion:
Based on the analysis of the technical indicators, the next few days' possible stock price movement for AUR is likely to be sideways with a slight bullish bias. While the trend indicators point towards a bullish sentiment, the mixed signals from momentum indicators and increased volatility suggest potential price fluctuations. Traders should closely monitor key support and resistance levels for potential entry and exit points.