Technical Analysis of AUTL 2024-05-10
Overview:
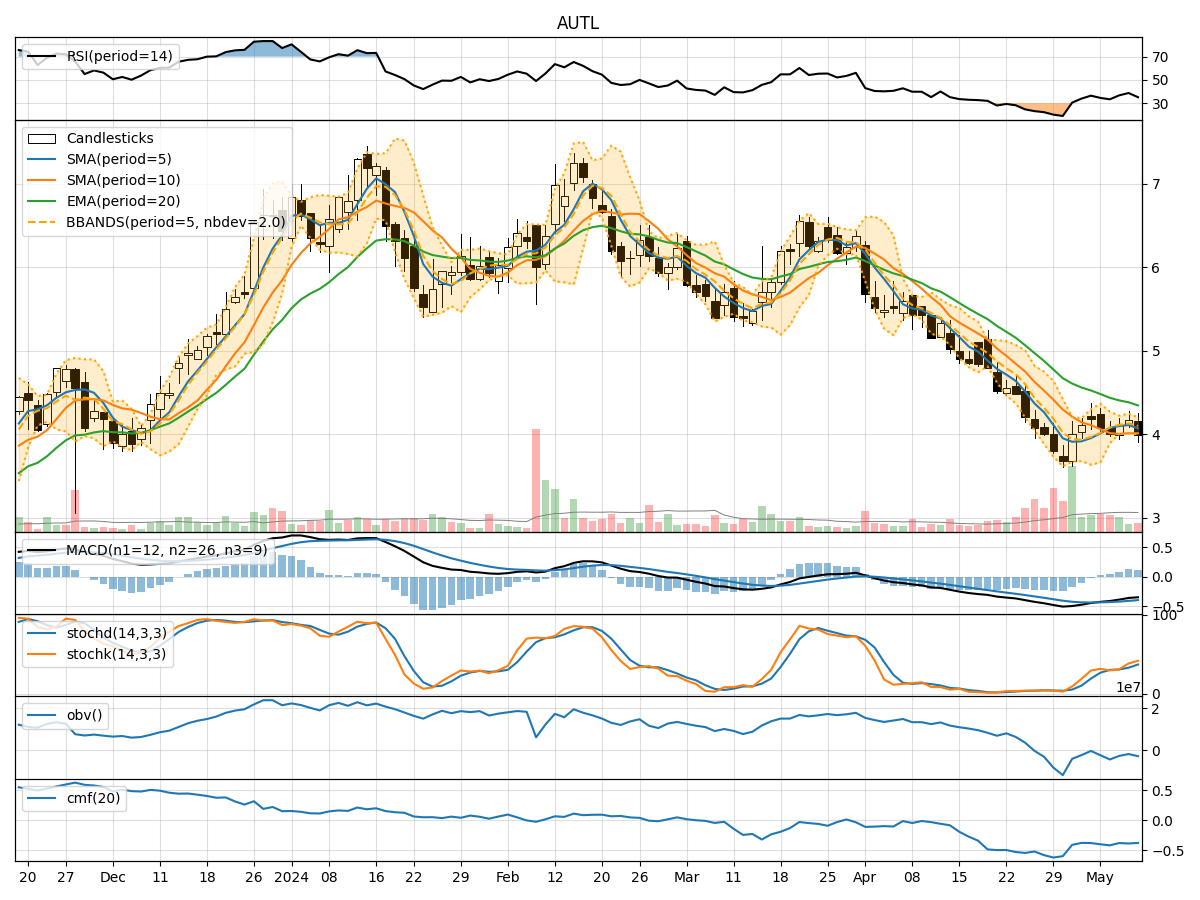
In analyzing the technical indicators for AUTL over the last 5 days, we will delve into the trend, momentum, volatility, and volume indicators to provide a comprehensive outlook on the possible stock price movement in the coming days. By examining these key aspects, we aim to offer valuable insights and predictions to guide your investment decisions.
Trend Analysis:
- Moving Averages (MA): The 5-day Moving Average (MA) has been fluctuating around the closing prices, indicating short-term price trends. The Simple Moving Average (SMA) and Exponential Moving Average (EMA) show a downward trend, suggesting a bearish sentiment.
- Moving Average Convergence Divergence (MACD): The MACD and Signal Line are negative, indicating a bearish trend in the stock price momentum.
Momentum Analysis:
- Relative Strength Index (RSI): The RSI is below 50, indicating a bearish momentum in the stock.
- Stochastic Oscillator: Both %K and %D are below 50, signaling a bearish sentiment.
- Williams %R (WillR): The Williams %R is in the oversold territory, suggesting a potential reversal or continuation of the downtrend.
Volatility Analysis:
- Bollinger Bands (BB): The stock price has been trading within the lower Bollinger Band, indicating a potential oversold condition.
- Bollinger Band Width (BBW): The BBW is relatively low, suggesting a period of consolidation or lack of significant price movement.
Volume Analysis:
- On-Balance Volume (OBV): The OBV has been fluctuating, indicating mixed buying and selling pressure.
- Chaikin Money Flow (CMF): The CMF is negative, suggesting a bearish sentiment in the stock.
Key Observations:
- The trend indicators show a bearish sentiment with declining moving averages and negative MACD.
- Momentum indicators support the bearish view with RSI below 50 and Stochastic Oscillator in bearish territory.
- Volatility indicators suggest a period of consolidation or lack of significant price movement.
- Volume indicators reflect mixed buying and selling pressure with a negative CMF.
Conclusion:
Based on the analysis of the technical indicators, the outlook for AUTL in the next few days is bearish. The stock is likely to experience further downward pressure, potentially testing lower support levels. Traders and investors should exercise caution and consider short-term strategies to navigate the bearish market conditions. It is advisable to closely monitor key support levels and wait for potential reversal signals before considering long positions.