Technical Analysis of BASE 2024-05-10
Overview:
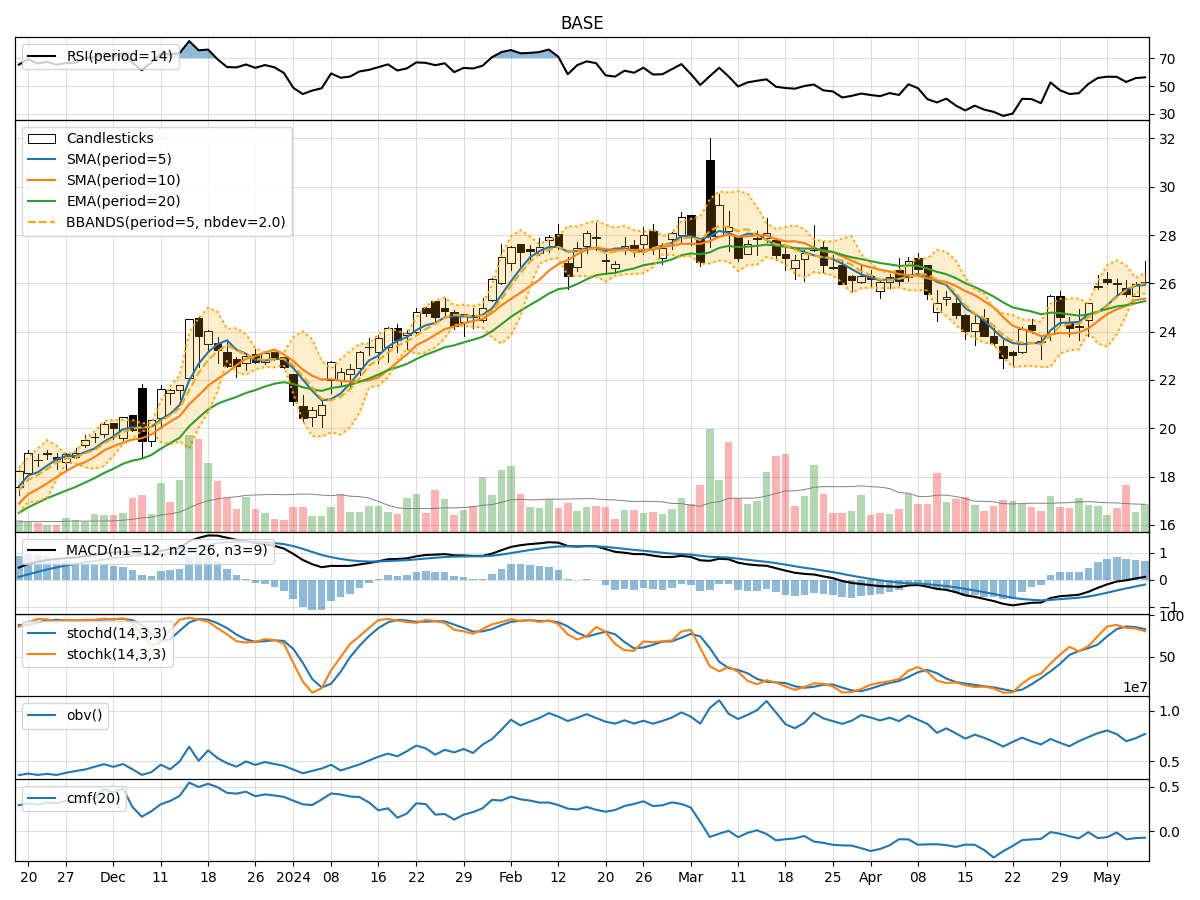
In analyzing the provided technical indicators for the last 5 days, we will delve into the trend, momentum, volatility, and volume indicators to forecast the possible stock price movement for the next few days. By examining these key aspects, we aim to provide a comprehensive and insightful prediction backed by data-driven analysis.
Trend Indicators:
- Moving Averages (MA): The 5-day MA has been consistently above the closing prices, indicating an upward trend. This suggests a positive momentum in the stock price.
- MACD: The MACD line has been consistently above the signal line, with decreasing values, indicating a weakening bullish momentum.
- EMA: The EMA has been trending upwards, supporting the notion of a bullish trend in the stock price.
Momentum Indicators:
- RSI: The RSI values have been fluctuating around the mid-level, indicating neutral momentum in the stock.
- Stochastic Oscillator: Both %K and %D values have been gradually decreasing, suggesting a weakening bullish momentum.
- Williams %R: The Williams %R values have been hovering in the oversold territory, indicating a potential reversal in the stock price.
Volatility Indicators:
- Bollinger Bands (BB): The stock price has been trading within the bands, with the %B indicator showing values around 0.5, indicating neutral volatility.
- Average True Range (ATR): The ATR values have been relatively stable, suggesting consistent volatility in the stock price.
Volume Indicators:
- On-Balance Volume (OBV): The OBV values have been fluctuating, indicating mixed sentiment among investors.
- Chaikin Money Flow (CMF): The CMF values have been negative, suggesting outflow of money from the stock.
Key Observations:
- The trend indicators point towards a bullish bias in the stock price, supported by the moving averages and EMA.
- Momentum indicators show a weakening bullish momentum, as seen in the RSI and Stochastic Oscillator values.
- Volatility indicators suggest neutral volatility, with the stock price trading within the Bollinger Bands.
- Volume indicators reflect mixed sentiment among investors, with the OBV and CMF values showing divergent trends.
Conclusion:
Based on the analysis of the technical indicators, the next few days' possible stock price movement is likely to exhibit sideways consolidation with a slight downward bias. While the trend indicators signal a bullish bias, the weakening momentum and mixed volume sentiment suggest a potential consolidation phase. Traders should exercise caution and closely monitor key support and resistance levels for potential entry or exit points.
Recommendation:
- Short-term Traders: Consider taking profits on existing long positions and wait for clearer signals before entering new positions.
- Long-term Investors: Monitor the stock price closely for potential buying opportunities during dips in the price.
By combining insights from trend, momentum, volatility, and volume indicators, investors can make informed decisions and adapt their strategies to navigate the dynamic stock market environment effectively.