Technical Analysis of BCAN 2024-05-10
Overview:
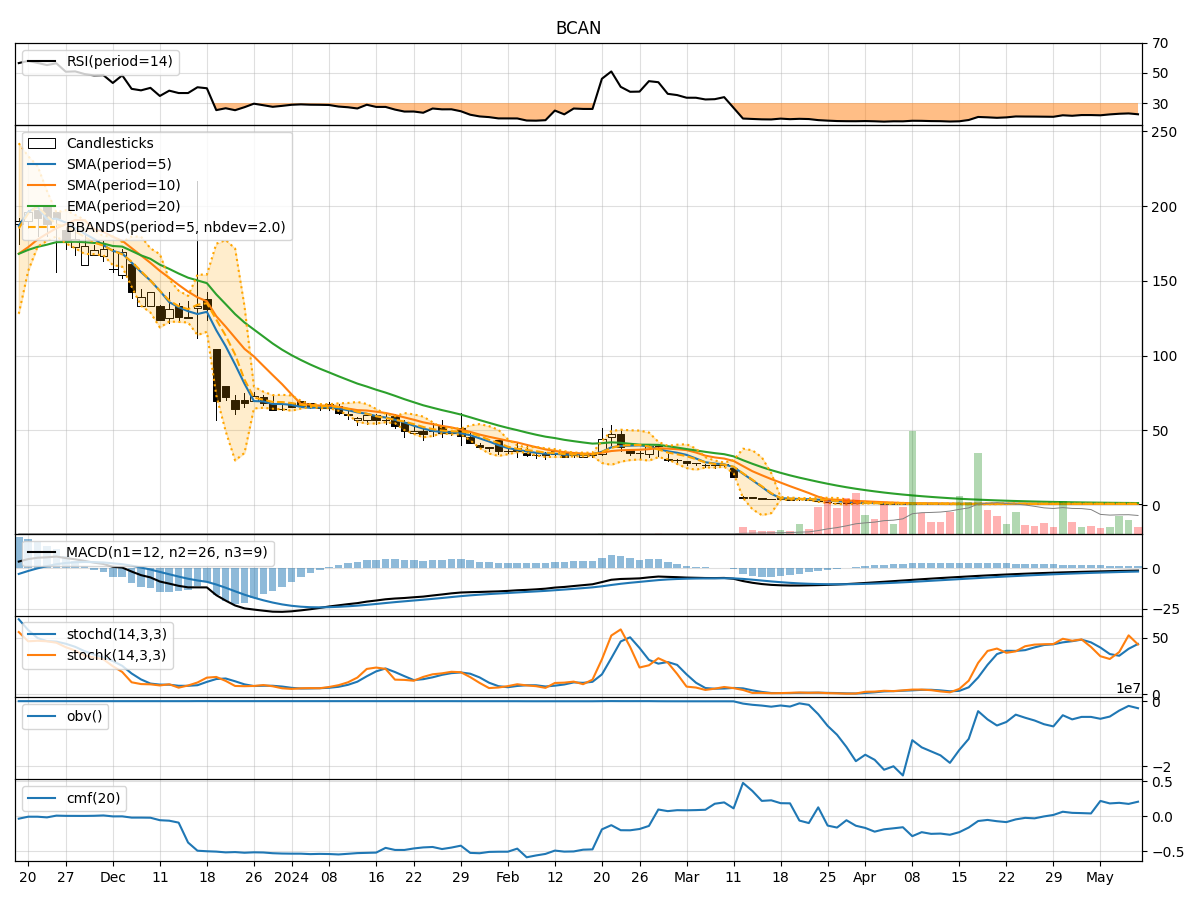
In analyzing the technical indicators for BCAN over the last 5 days, we will delve into the trend, momentum, volatility, and volume indicators to provide a comprehensive outlook on the possible stock price movement in the coming days.
Trend Analysis:
- Moving Averages (MA): The 5-day MA has been fluctuating around the 0.91-0.92 range, indicating a short-term consolidation phase.
- MACD: The MACD line has been consistently negative, suggesting a bearish trend in the short term.
- EMA: The EMA has been declining steadily, reflecting a downward momentum in the stock price.
Momentum Analysis:
- RSI: The RSI has been hovering around the oversold territory, indicating a potential reversal or consolidation phase.
- Stochastic Oscillator: The Stochastic indicators have shown mixed signals, with the %K line fluctuating and the %D line showing a slight upward trend.
- Williams %R: The Williams %R has been consistently in the oversold region, signaling a bearish sentiment.
Volatility Analysis:
- Bollinger Bands (BB): The Bollinger Bands have been narrowing, suggesting a decrease in volatility and a possible upcoming breakout.
- BB% (BB Percentage): The BB% has been relatively low, indicating a period of consolidation or a potential price reversal.
Volume Analysis:
- On-Balance Volume (OBV): The OBV has shown a mixed trend, with some days experiencing selling pressure and others showing accumulation.
- Chaikin Money Flow (CMF): The CMF has been positive but relatively flat, indicating a neutral sentiment towards the stock.
Key Observations:
- The stock is currently in a consolidation phase with a bearish bias, as indicated by the negative MACD and oversold RSI.
- Volatility has been decreasing, suggesting a potential breakout or a period of low trading activity.
- The volume indicators show mixed signals, reflecting uncertainty among market participants.
Conclusion:
Based on the analysis of the technical indicators, the stock is likely to continue its downward trend in the short term. Traders should exercise caution and consider waiting for clearer signals before making any significant trading decisions. The consolidation phase may persist, with a potential breakout on the horizon. It is advisable to closely monitor the price action and key support/resistance levels for better decision-making.