Technical Analysis of BCRX 2024-05-10
Overview:
In analyzing the technical indicators for BCRX over the last 5 days, we will delve into the trend, momentum, volatility, and volume indicators to provide a comprehensive outlook on the possible stock price movement. By examining these key factors, we aim to offer valuable insights and predictions for the upcoming days.
Trend Indicators:
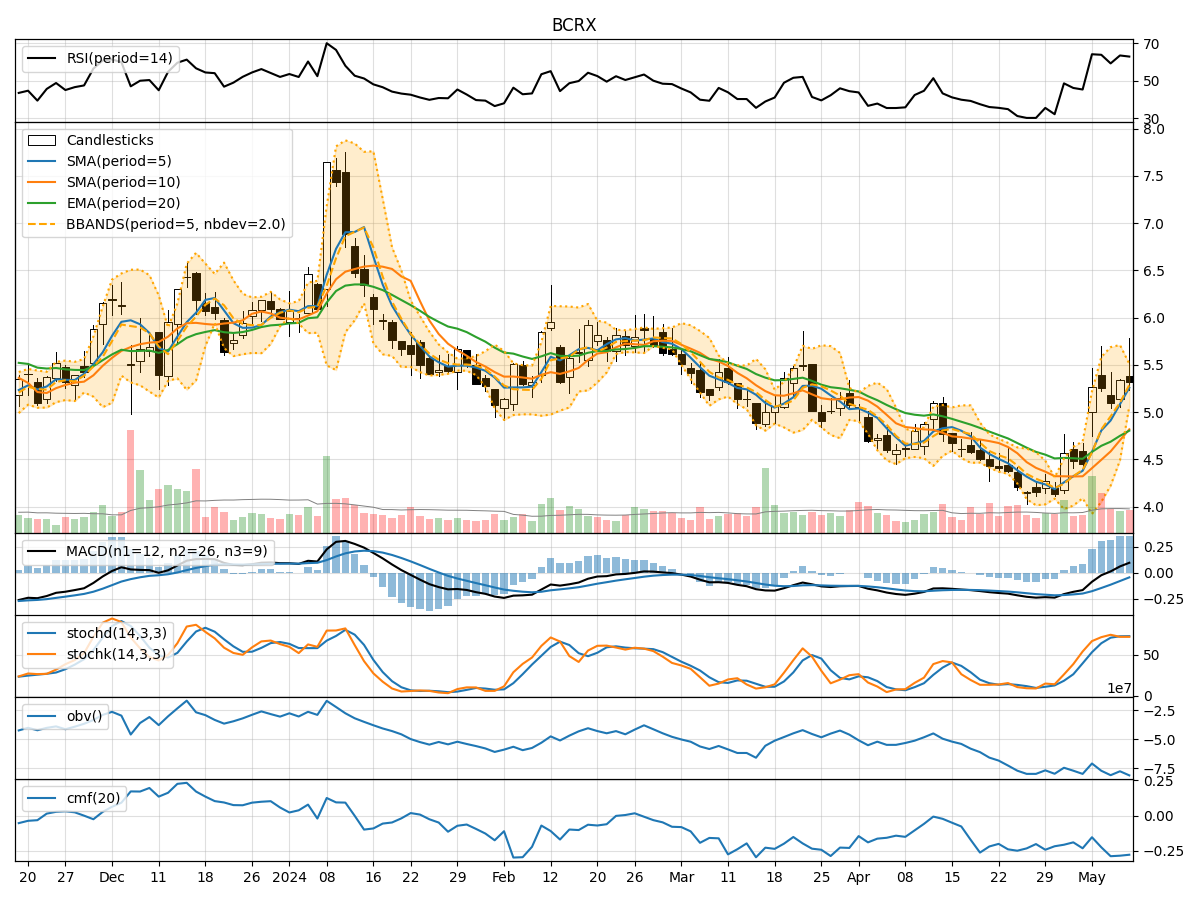
- Moving Averages (MA): The 5-day moving average has been consistently rising, indicating a bullish trend in the short term.
- MACD: The MACD line has been above the signal line for the past few days, suggesting positive momentum.
- EMA: The exponential moving average has also been trending upwards, supporting the bullish sentiment.
Momentum Indicators:
- RSI: The Relative Strength Index has been hovering around the 60-70 range, indicating a neutral to slightly bullish momentum.
- Stochastic Oscillator: Both %K and %D have been in the overbought territory, signaling a potential reversal or consolidation.
- Williams %R: The indicator has been fluctuating around the oversold region, suggesting a mixed sentiment.
Volatility Indicators:
- Bollinger Bands: The widening of the bands indicates increased volatility, potentially leading to significant price movements.
- Bollinger %B: The %B value has been fluctuating, reflecting the volatility in the stock price.
- Average True Range (ATR): ATR has shown an uptrend, indicating rising volatility in the stock.
Volume Indicators:
- On-Balance Volume (OBV): The OBV has been declining, suggesting selling pressure in the stock.
- Chaikin Money Flow (CMF): The CMF has been negative, indicating outflow of money from the stock.
Key Observations and Opinions:
- Trend: The trend indicators suggest a bullish bias in the short term, supported by moving averages and MACD.
- Momentum: Momentum indicators show a mixed sentiment with potential for a reversal due to overbought conditions in the stochastic oscillator.
- Volatility: Increasing volatility, as indicated by Bollinger Bands and ATR, could lead to significant price swings.
- Volume: Declining OBV and negative CMF signal bearish sentiment and potential downward pressure on the stock.
Conclusion:
Based on the analysis of the technical indicators, the stock of BCRX is likely to experience sideways to slightly bearish movement in the upcoming days. While the trend remains bullish in the short term, the overbought conditions in the momentum indicators and negative volume signals suggest a possible correction or consolidation. Traders should exercise caution and consider potential profit-taking opportunities in the face of increased volatility and selling pressure.