Technical Analysis of BCSA 2024-05-10
Overview:
In analyzing the technical indicators for BCSA over the last 5 days, we will delve into the trend, momentum, volatility, and volume indicators to provide a comprehensive outlook on the possible stock price movement in the coming days. By examining these key aspects, we aim to offer valuable insights and predictions to guide your investment decisions.
Trend Analysis:
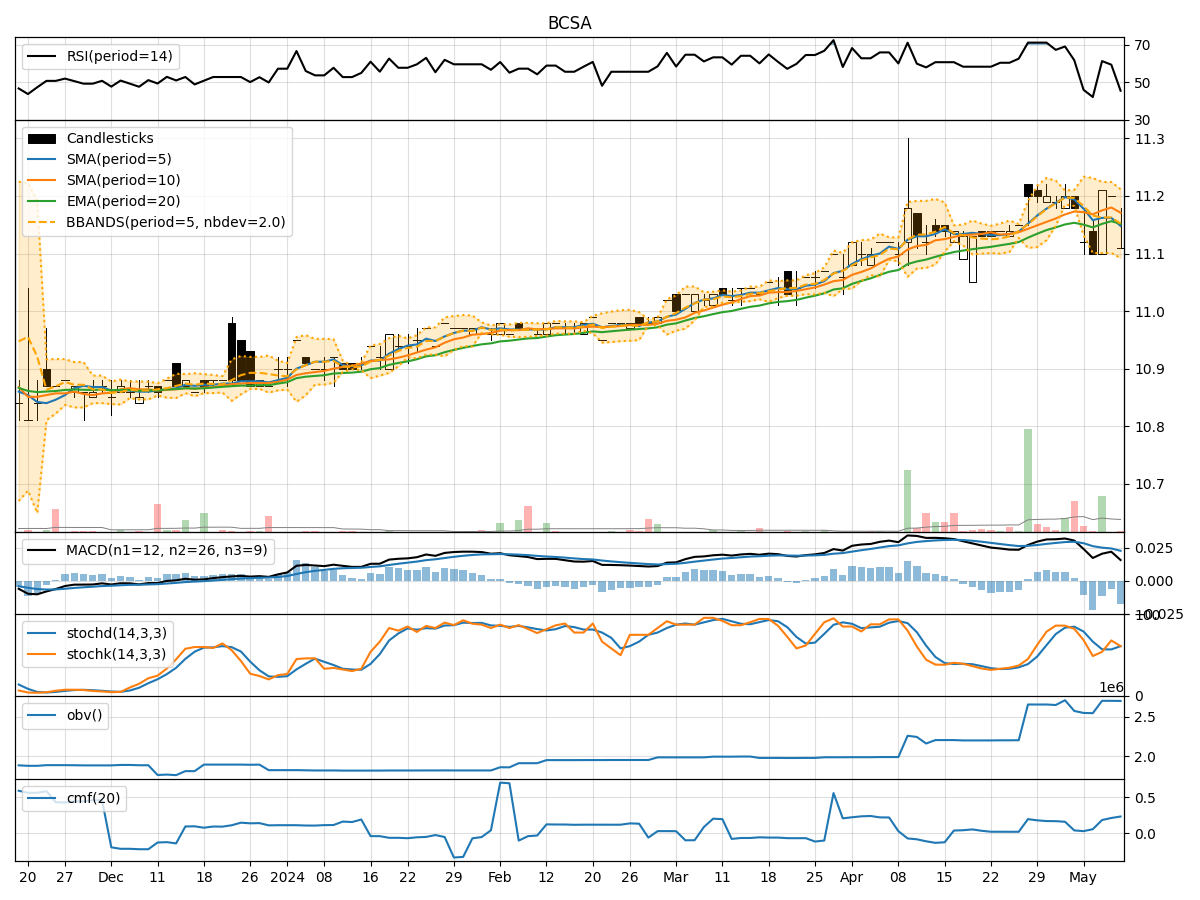
- Moving Averages (MA): The 5-day Moving Average (MA) has been fluctuating around the closing prices, indicating a lack of clear trend direction.
- MACD: The Moving Average Convergence Divergence (MACD) has shown positive values, suggesting a potential bullish momentum.
- EMA: The Exponential Moving Average (EMA) has been relatively stable, reflecting a neutral trend.
Key Observation: The trend indicators suggest a mixed outlook with a slight bullish bias.
Momentum Analysis:
- RSI: The Relative Strength Index (RSI) has been oscillating within the neutral zone, indicating indecision in the market.
- Stochastic Oscillator: Both %K and %D have shown fluctuations, signaling a lack of strong momentum.
- Williams %R: The Williams %R has been hovering in the oversold territory, suggesting a potential reversal.
Key Observation: Momentum indicators point towards a neutral to slightly bearish sentiment.
Volatility Analysis:
- Bollinger Bands: The Bollinger Bands have shown narrowing width, indicating decreasing volatility.
- Bollinger %B: The %B indicator has been fluctuating within a moderate range, reflecting stability in price movements.
Key Observation: Volatility indicators suggest a period of consolidation and potential price stability.
Volume Analysis:
- On-Balance Volume (OBV): The OBV has shown mixed movements, indicating uncertainty in the buying and selling pressure.
- Chaikin Money Flow (CMF): The CMF has been positive, suggesting a slight inflow of money into the stock.
Key Observation: Volume indicators reflect a lack of clear direction in market participation.
Conclusion:
Based on the analysis of the technical indicators, the next few days for BCSA stock price movement are likely to be sideways with a slight bullish bias. The trend indicators show a mixed outlook, while momentum indicators lean towards a neutral to slightly bearish sentiment. Volatility indicators point towards consolidation and stability, while volume indicators indicate uncertainty in market participation.
Overall Assessment: The stock is expected to trade within a narrow range in the coming days, with a potential for a modest upside movement. Traders should exercise caution and closely monitor key support and resistance levels for potential breakout opportunities.