Technical Analysis of BDRX 2024-05-10
Overview:
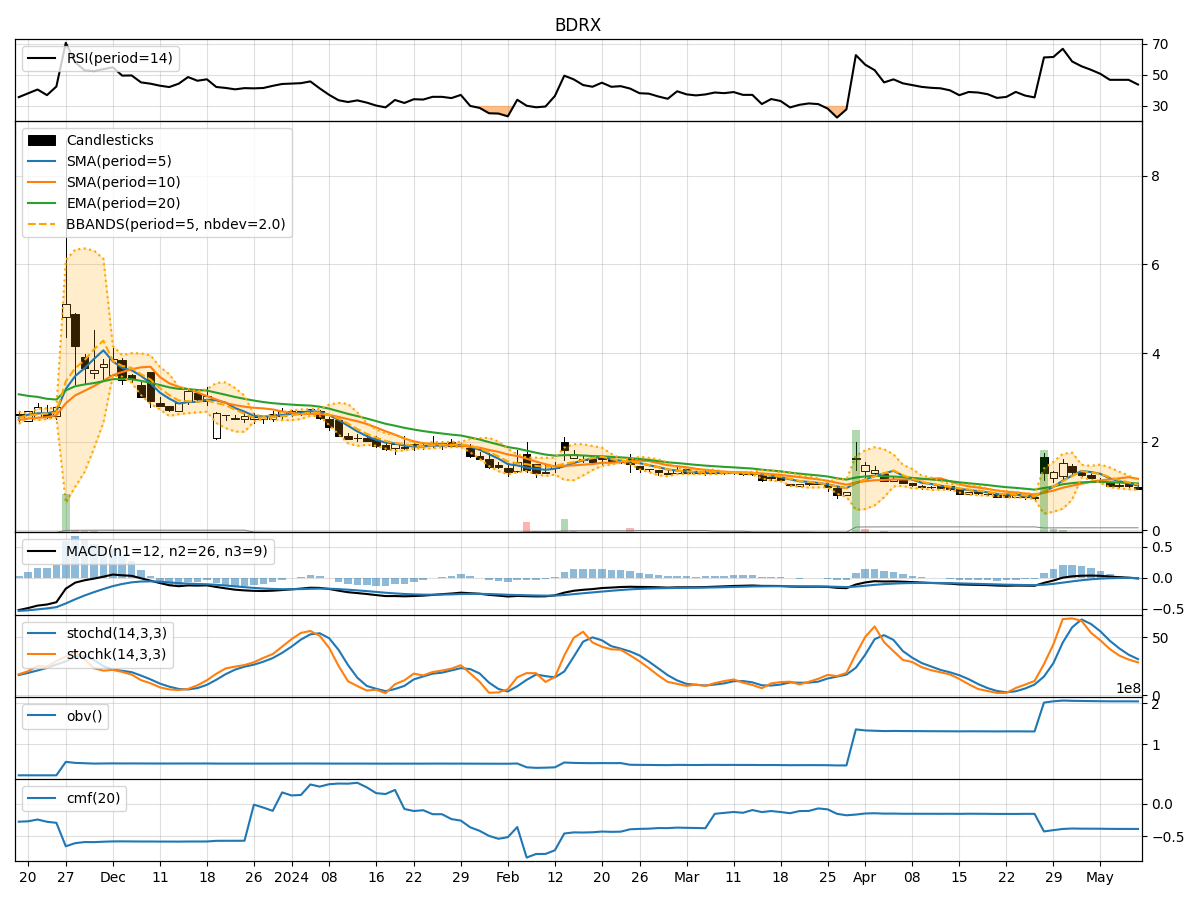
In analyzing the technical indicators for BDRX over the last 5 days, we will delve into the trend, momentum, volatility, and volume indicators to provide a comprehensive assessment of the stock's potential price movement. By examining these key factors, we aim to offer valuable insights and predictions for the next few days.
Trend Analysis:
- Moving Averages (MA): The 5-day MA has been consistently decreasing, indicating a downward trend in the stock price.
- MACD: The MACD line has been negative, suggesting bearish momentum in the stock.
- EMA: The EMA has also been declining, reinforcing the bearish sentiment in the stock.
Key Observation: The trend indicators point towards a strong bearish outlook for BDRX.
Momentum Analysis:
- RSI: The RSI has been decreasing, indicating weakening momentum in the stock.
- Stochastic Oscillator: Both %K and %D have been declining, signaling a loss in bullish momentum.
- Williams %R: The indicator has been in oversold territory, suggesting a potential reversal in the stock price.
Key Observation: Momentum indicators reflect a bearish sentiment with a possibility of a reversal in the near future.
Volatility Analysis:
- Bollinger Bands: The bands have been narrowing, indicating decreasing volatility in the stock.
- Bollinger %B: The %B has been decreasing, suggesting a potential consolidation phase.
Key Observation: Volatility indicators point towards a consolidation phase in BDRX.
Volume Analysis:
- On-Balance Volume (OBV): The OBV has been relatively stable, indicating no significant divergence in volume.
- Chaikin Money Flow (CMF): The CMF has been negative, suggesting selling pressure in the stock.
Key Observation: Volume indicators suggest a neutral stance with no clear direction.
Conclusion:
Based on the analysis of trend, momentum, volatility, and volume indicators, the overall outlook for BDRX in the next few days is bearish. The stock is likely to experience further downward movement, supported by the consistent decline in moving averages, negative MACD, and weakening momentum as indicated by RSI and Stochastic Oscillator. However, the narrowing Bollinger Bands and potential reversal signal from Williams %R indicate a possible consolidation phase before any significant price movement.
Key Conclusion: The next few days for BDRX are likely to see further downward movement with a possibility of consolidation before a potential reversal. Investors should exercise caution and consider waiting for clearer signals before making any trading decisions.