Technical Analysis of BELFB 2024-05-10
Overview:
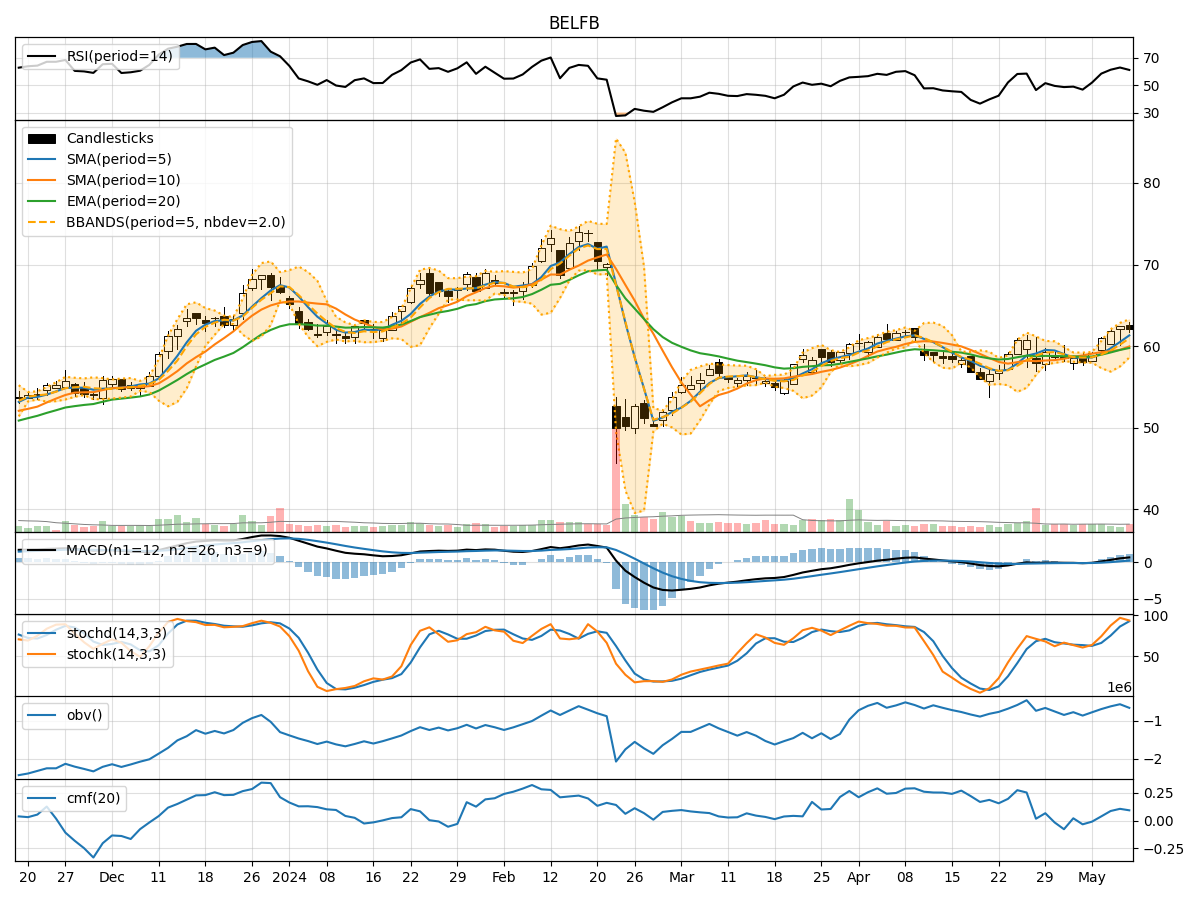
In analyzing the technical indicators for BELFB over the last 5 days, we will delve into the trend, momentum, volatility, and volume indicators to provide a comprehensive outlook on the possible stock price movement in the coming days.
Trend Indicators:
- Moving Averages (MA): The 5-day MA has been consistently above the closing prices, indicating a bullish trend.
- MACD: The MACD line has been above the signal line, suggesting a bullish momentum.
- RSI: The RSI has been trending upwards, indicating increasing buying pressure.
Momentum Indicators:
- Stochastic Oscillator: Both %K and %D have been in overbought territory, signaling a strong bullish momentum.
- Williams %R: The indicator has been fluctuating but generally in oversold territory, suggesting a potential reversal.
Volatility Indicators:
- Bollinger Bands: The stock price has been trading within the bands, indicating moderate volatility.
- BB%: The %B has been fluctuating around the midline, suggesting a balanced market sentiment.
Volume Indicators:
- On-Balance Volume (OBV): The OBV has been increasing, indicating accumulation by investors.
- Chaikin Money Flow (CMF): The CMF has been positive, reflecting buying pressure.
Key Observations:
- The trend indicators, momentum indicators, and volume indicators all point towards a bullish sentiment in the market.
- The volatility indicators suggest that the stock is currently experiencing moderate price fluctuations within a defined range.
Conclusion:
Based on the analysis of the technical indicators, it is highly likely that BELFB will experience further upward movement in the coming days. The bullish trend, strong momentum, positive volume accumulation, and moderate volatility all support a positive outlook for the stock. Traders and investors may consider taking long positions or holding onto existing positions to capitalize on the expected price appreciation.