Technical Analysis of BENF 2024-05-31
Overview:
In analyzing the technical indicators for BENF over the last 5 days, we will delve into the trend, momentum, volatility, and volume indicators to provide a comprehensive outlook on the possible stock price movement in the coming days. By examining these key aspects, we aim to offer valuable insights and predictions to guide investment decisions.
Trend Analysis:
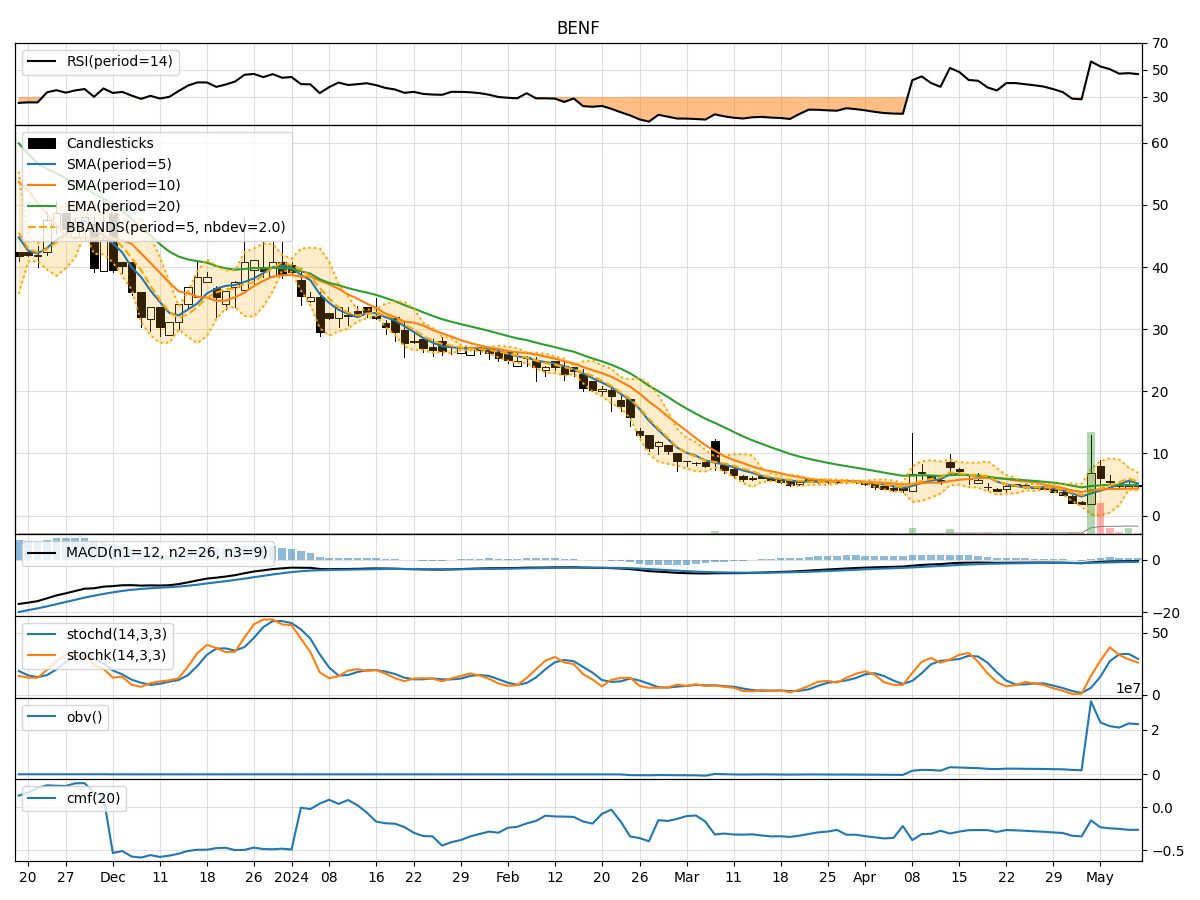
- Moving Averages (MA): The 5-day moving average (MA) has been fluctuating around the closing prices, indicating short-term price trends. The Simple Moving Average (SMA) and Exponential Moving Average (EMA) show a downward trend, suggesting a bearish sentiment in the market.
- MACD: The Moving Average Convergence Divergence (MACD) and its signal line (MACDH) have been consistently negative, indicating a bearish momentum in the stock.
Momentum Analysis:
- RSI: The Relative Strength Index (RSI) has been hovering around 40-44, indicating a neutral to slightly bearish momentum.
- Stochastic Oscillator: Both %K and %D values of the Stochastic Oscillator are below 20, suggesting an oversold condition and a potential reversal in the stock price.
Volatility Analysis:
- Bollinger Bands (BB): The Bollinger Bands show a narrowing range, indicating decreasing volatility in the stock price.
Volume Analysis:
- On-Balance Volume (OBV): The OBV has been relatively stable, indicating a balance between buying and selling pressure.
- Chaikin Money Flow (CMF): The CMF has been negative, suggesting a bearish money flow in the stock.
Key Observations:
- The trend indicators point towards a bearish sentiment, with moving averages and MACD signaling a downward trend.
- Momentum indicators suggest a neutral to slightly bearish momentum, with the Stochastic Oscillator indicating a potential oversold condition.
- Volatility is decreasing, as shown by the narrowing Bollinger Bands, which may lead to a period of consolidation.
- Volume indicators reflect a balance between buying and selling pressure, with a bearish money flow indicated by the CMF.
Conclusion:
Based on the analysis of the technical indicators, the outlook for BENF in the next few days is bearish. The trend indicators, momentum signals, and volume analysis all point towards a potential downward movement in the stock price. Traders and investors should exercise caution and consider shorting or staying on the sidelines until a clearer bullish signal emerges. It is advisable to closely monitor the Stochastic Oscillator for a potential reversal confirmation.