Technical Analysis of BFST 2024-05-10
Overview:
In analyzing the technical indicators for BFST over the last 5 days, we will delve into the trend, momentum, volatility, and volume indicators to provide a comprehensive outlook on the possible stock price movement in the coming days. By examining these key aspects, we aim to offer valuable insights and predictions for potential investors.
Trend Analysis:
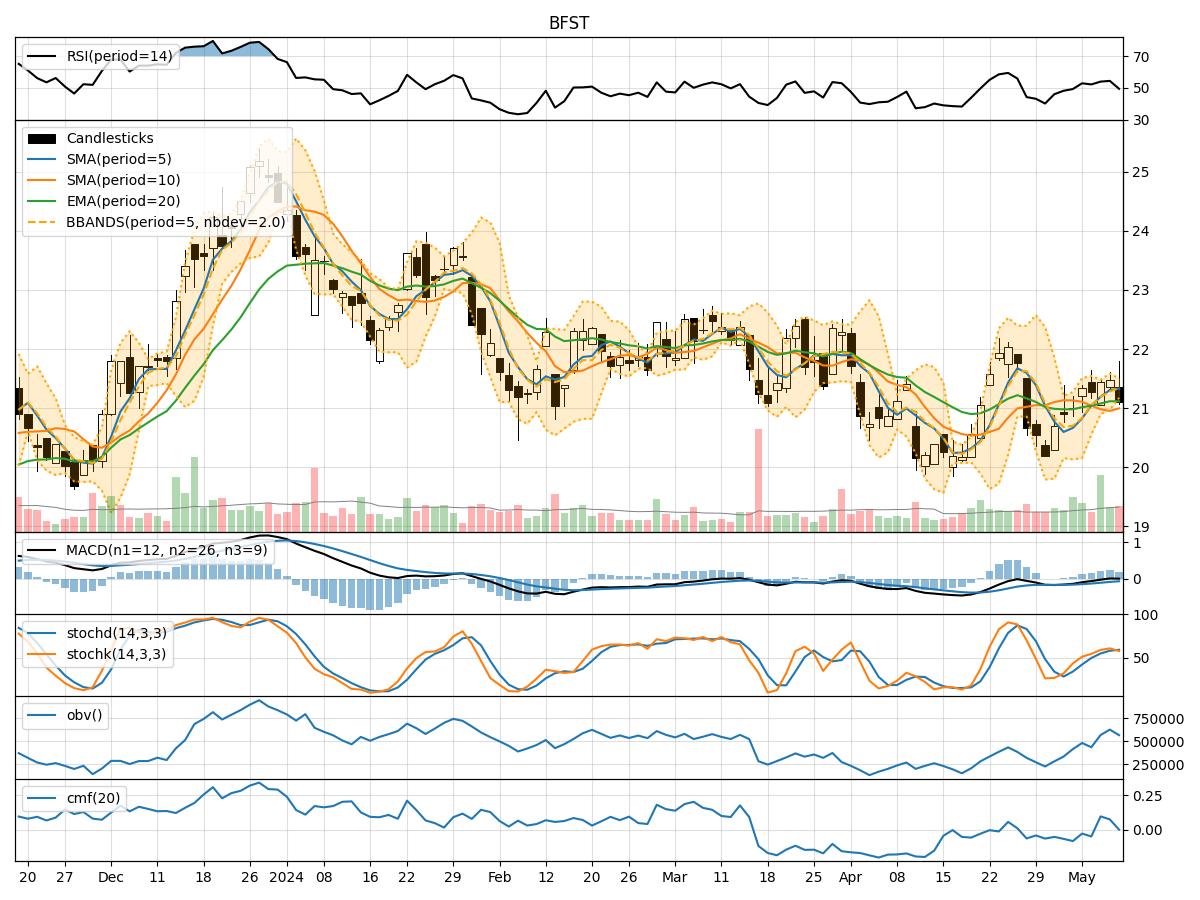
- Moving Averages (MA): The 5-day Moving Average (MA) has been consistently above the closing prices, indicating a short-term uptrend.
- MACD: The Moving Average Convergence Divergence (MACD) has shown positive values, suggesting bullish momentum.
- RSI: The Relative Strength Index (RSI) has been fluctuating around the neutral zone, indicating a balanced market sentiment.
Momentum Analysis:
- Stochastic Oscillator: The Stochastic Oscillator has been in the overbought territory, signaling potential price reversal.
- Williams %R: The Williams %R indicator has been in the oversold region, hinting at a possible buying opportunity.
Volatility Analysis:
- Bollinger Bands: The Bollinger Bands have shown narrowing bands, indicating decreasing volatility and a potential price breakout.
- Average True Range (ATR): The ATR has been relatively stable, suggesting a lack of significant price fluctuations.
Volume Analysis:
- On-Balance Volume (OBV): The OBV has shown mixed movements, reflecting indecision among market participants.
- Chaikin Money Flow (CMF): The CMF has been fluctuating around the zero line, indicating a neutral money flow trend.
Key Observations:
- The trend indicators suggest a bullish bias in the short term.
- Momentum indicators show conflicting signals with the Stochastic Oscillator and Williams %R.
- Volatility remains relatively low, potentially leading to a breakout.
- Volume indicators reflect mixed market participation and sentiment.
Conclusion:
Based on the analysis of the technical indicators, the stock price of BFST is likely to experience further upward movement in the coming days. The bullish trend indicated by moving averages and MACD, coupled with the potential breakout suggested by volatility indicators, supports a positive outlook. However, investors should remain cautious of the conflicting signals from momentum indicators and the mixed volume trends. Overall, the bullish sentiment is favored, but close monitoring of key indicators is recommended to navigate potential market fluctuations.