Technical Analysis of BHAT 2024-05-10
Overview:
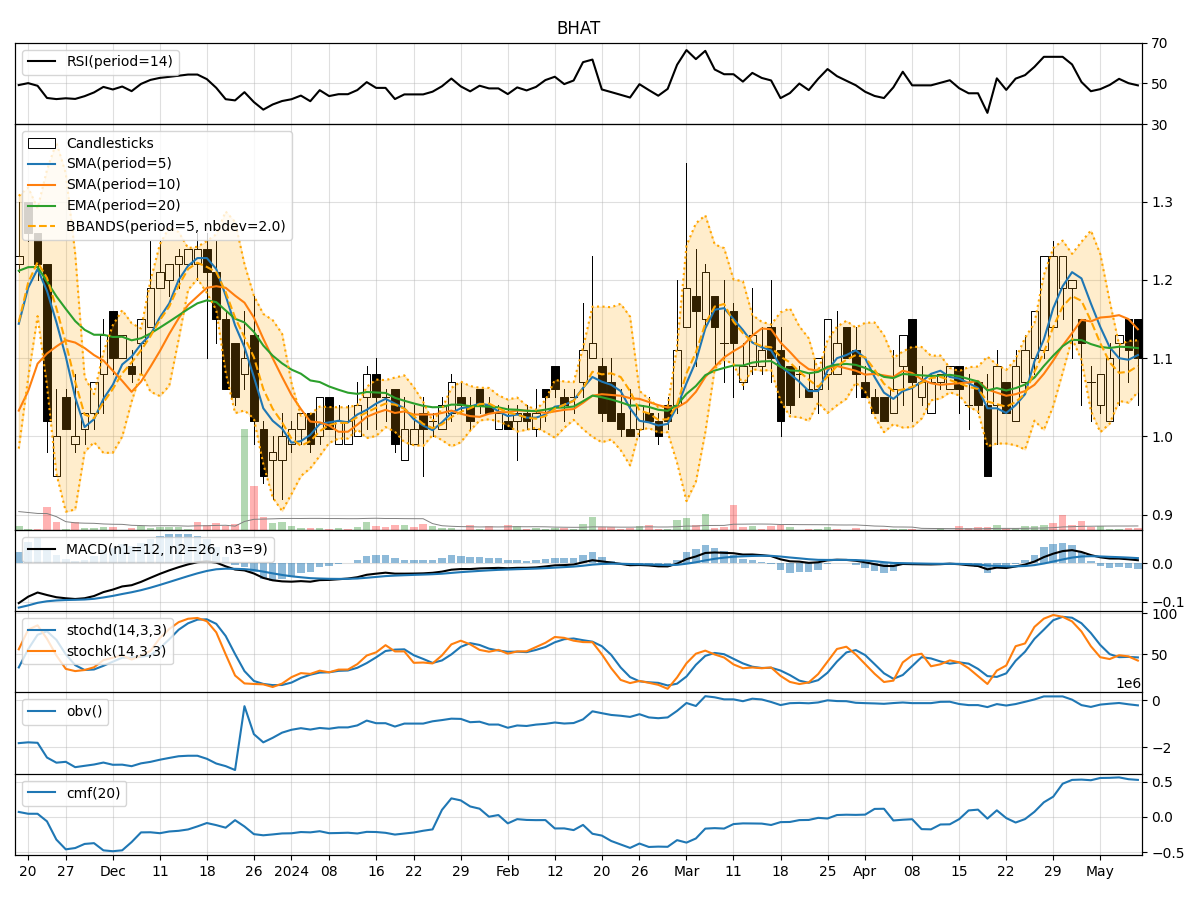
In analyzing the technical indicators for BHAT over the last 5 days, we will delve into the trend, momentum, volatility, and volume indicators to provide a comprehensive outlook on the possible stock price movement in the coming days.
Trend Analysis:
- Moving Averages (MA): The 5-day Moving Average (MA) has been declining, indicating a short-term bearish trend.
- MACD: The MACD line has been decreasing, with the MACD histogram also showing a downward trend, suggesting a bearish momentum.
Momentum Analysis:
- RSI: The Relative Strength Index (RSI) has been fluctuating around the neutral zone, indicating indecision in the market.
- Stochastic Oscillator: Both %K and %D have been declining, signaling a bearish momentum.
Volatility Analysis:
- Bollinger Bands (BB): The Bollinger Bands have been narrowing, indicating decreasing volatility in the stock price.
Volume Analysis:
- On-Balance Volume (OBV): The OBV has been fluctuating, suggesting mixed buying and selling pressure.
- Chaikin Money Flow (CMF): The CMF has been relatively stable, indicating a neutral money flow.
Key Observations:
- The trend indicators show a bearish sentiment with declining moving averages and MACD.
- Momentum indicators also support the bearish view with decreasing Stochastic Oscillator values.
- Volatility has been decreasing, indicating a potential period of consolidation.
- Volume indicators suggest mixed buying and selling pressure with no clear direction.
Conclusion:
Based on the analysis of the technical indicators, the stock price of BHAT is likely to continue its downward trend in the coming days. The bearish sentiment indicated by the trend and momentum indicators, coupled with decreasing volatility and mixed volume signals, point towards a potential further decline in the stock price. Traders and investors should exercise caution and consider short-term selling strategies or wait for a more definitive trend reversal signal before considering long positions.