Technical Analysis of BHF 2024-05-10
Overview:
In analyzing the technical indicators for BHF over the last 5 days, we will delve into the trend, momentum, volatility, and volume indicators to provide a comprehensive outlook on the possible stock price movement in the coming days. By examining these key aspects, we aim to offer valuable insights and predictions for potential investors.
Trend Analysis:
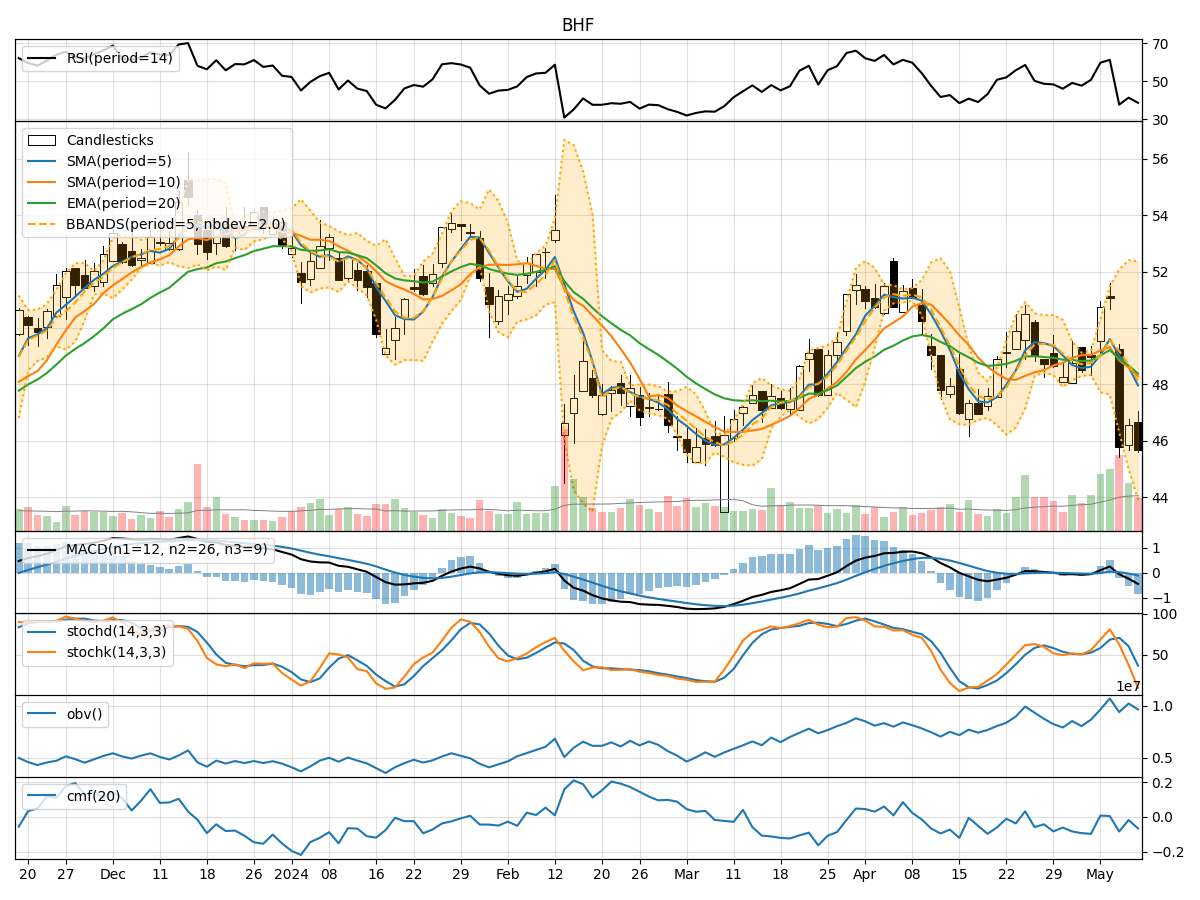
- Moving Averages (MA): The 5-day Moving Average (MA) has been fluctuating, indicating some volatility in the stock price.
- MACD: The Moving Average Convergence Divergence (MACD) has shown negative values, suggesting a bearish trend.
- EMA: The Exponential Moving Average (EMA) has been below the MA, indicating a potential downtrend.
Momentum Analysis:
- RSI: The Relative Strength Index (RSI) has been below 50, indicating a bearish momentum.
- Stochastic Oscillator: Both %K and %D have been decreasing, signaling a bearish sentiment.
- Williams %R: The indicator has been in the oversold territory, suggesting a potential reversal.
Volatility Analysis:
- Bollinger Bands: The stock price has been trading below the lower Bollinger Band, indicating oversold conditions.
- Volatility Bands: The bands have widened, suggesting increased volatility in the stock price.
Volume Analysis:
- On-Balance Volume (OBV): The OBV has shown mixed signals, indicating indecision among investors.
- Chaikin Money Flow (CMF): The CMF has been negative, suggesting outflow of money from the stock.
Key Observations:
- The trend indicators point towards a bearish sentiment, with the MACD and EMA signaling a potential downtrend.
- Momentum indicators also support a bearish view, with RSI below 50 and Stochastic Oscillator in a downward trend.
- Volatility has increased, as seen in the widening Bollinger Bands, indicating potential price fluctuations.
- Volume indicators show mixed signals, with OBV fluctuating and CMF in negative territory.
Conclusion:
Based on the analysis of the technical indicators, the next few days for BHF stock price are likely to see further downward movement. The bearish trend indicated by the MACD, EMA, RSI, and Stochastic Oscillator, coupled with increased volatility and negative CMF, suggest a continuation of the current bearish sentiment. Investors should exercise caution and consider potential short-selling opportunities or wait for a clear reversal signal before considering long positions.