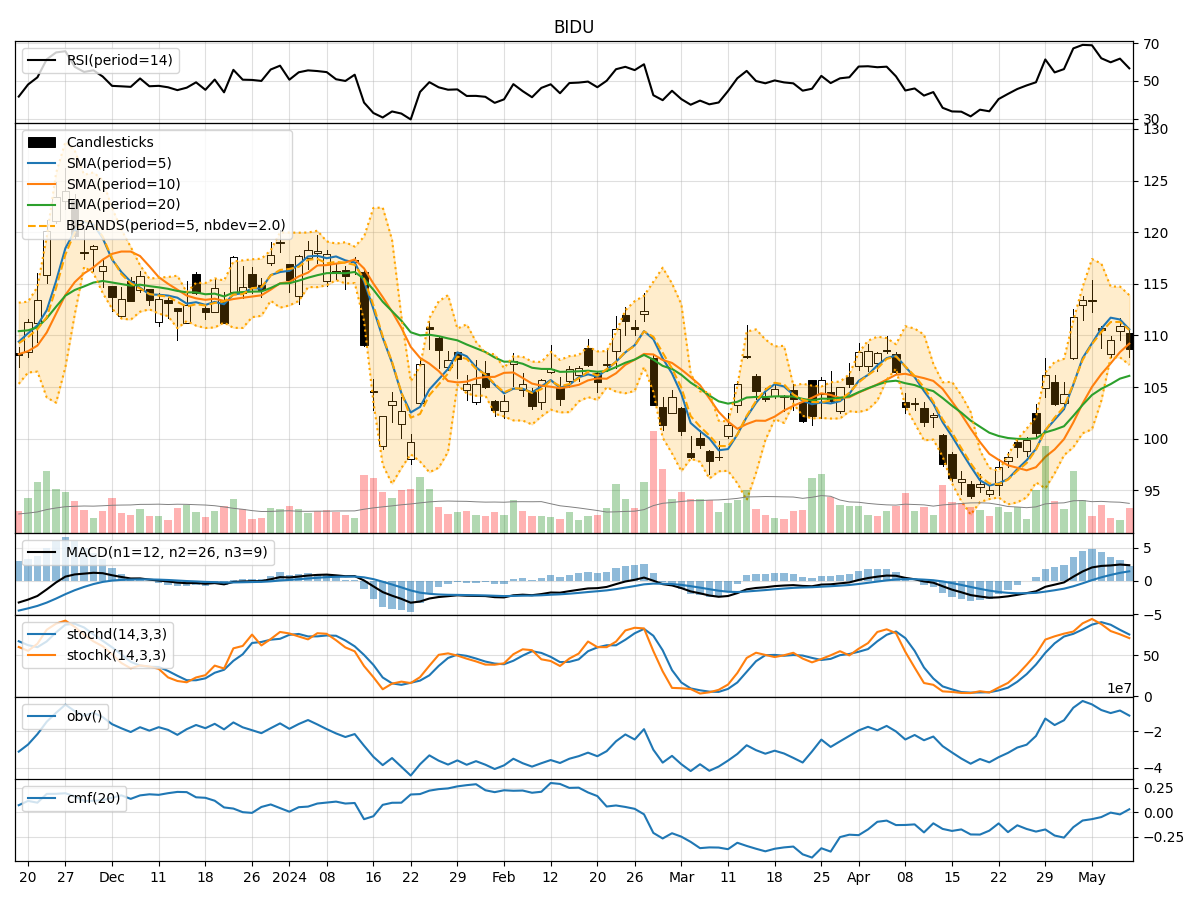
Technical Analysis of BIDU 2024-05-10
Overview:
In analyzing the technical indicators for BIDU over the last 5 days, we will delve into the trend, momentum, volatility, and volume indicators to provide a comprehensive outlook on the possible stock price movement in the coming days.
Trend Indicators:
- Moving Averages (MA): The 5-day Moving Average (MA) has been fluctuating around the Simple Moving Average (SMA) and Exponential Moving Average (EMA) values, indicating a lack of clear trend direction.
- MACD: The Moving Average Convergence Divergence (MACD) has shown positive values, with the MACD line consistently above the Signal line, suggesting a bullish momentum.
- Conclusion: The trend indicators suggest a bullish sentiment in the short term.
Momentum Indicators:
- RSI: The Relative Strength Index (RSI) has been oscillating around the 50 level, indicating a neutral momentum.
- Stochastic Oscillator: Both %K and %D values have been declining, signaling a potential bearish momentum.
- Conclusion: The momentum indicators point towards a neutral to bearish outlook.
Volatility Indicators:
- Bollinger Bands: The Bollinger Bands have been narrowing, indicating decreasing volatility in the stock price.
- Conclusion: Volatility is decreasing, suggesting a possible period of consolidation or sideways movement.
Volume Indicators:
- On-Balance Volume (OBV): The OBV has been fluctuating, showing no clear trend in volume accumulation.
- Chaikin Money Flow (CMF): The CMF has been negative, indicating a lack of buying pressure.
- Conclusion: Volume indicators reflect a neutral stance with no significant accumulation or distribution.
Overall Conclusion:
Based on the analysis of the technical indicators, the stock price of BIDU is likely to experience sideways movement in the coming days, with a neutral to bearish momentum. The decreasing volatility suggests a period of consolidation, while the trend indicators hint at a short-term bullish sentiment. It is essential for investors to closely monitor the momentum indicators for any potential shift in market sentiment.
Recommendation:
Given the mixed signals from the technical indicators, it is advisable for investors to exercise caution and wait for more clarity in the market direction before making any significant trading decisions. Monitoring key support and resistance levels along with keeping an eye on any developments in market news or company-specific events can provide valuable insights for navigating the stock price movement effectively.