Technical Analysis of BLBX 2024-05-31
Overview:
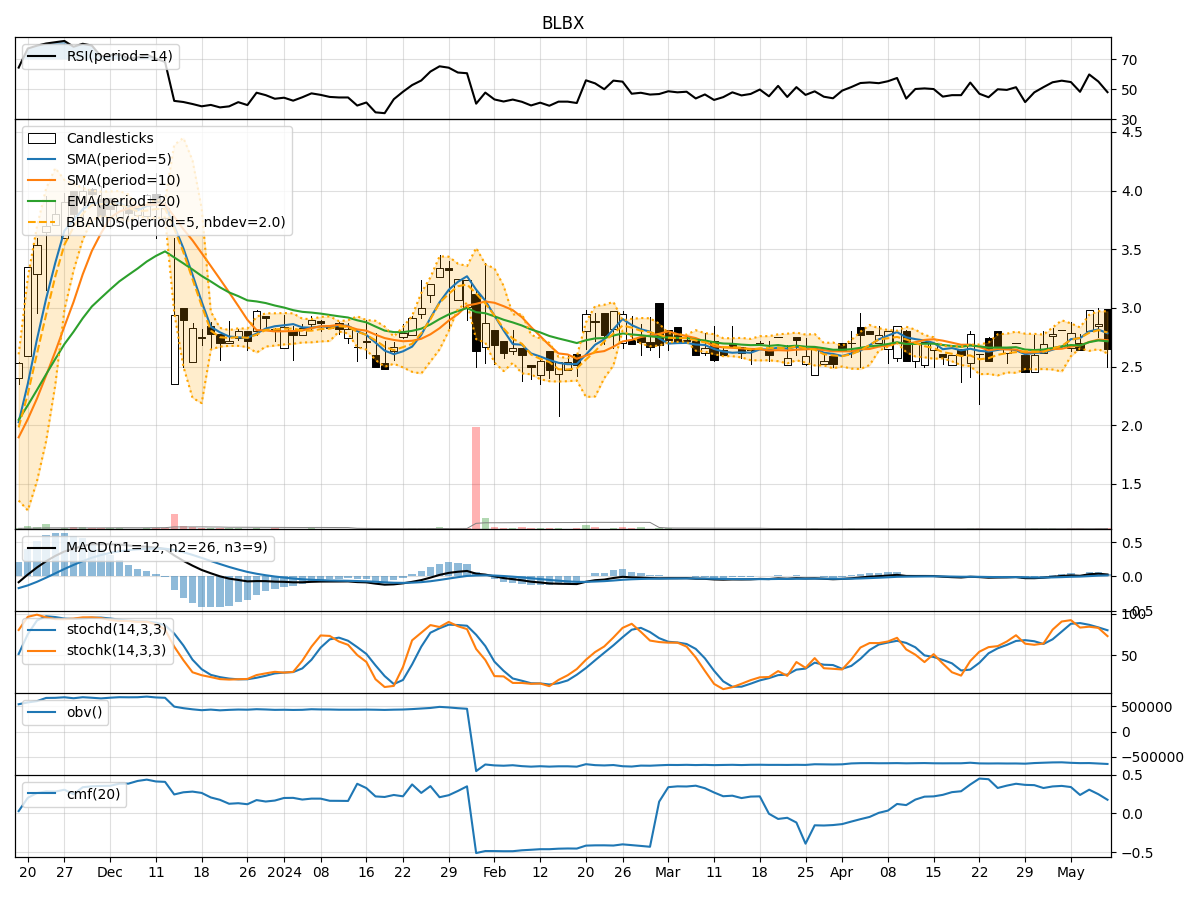
In analyzing the technical indicators for BLBX over the last 5 days, we will delve into the trend, momentum, volatility, and volume indicators to provide a comprehensive outlook on the possible stock price movement in the coming days. By examining these key indicators, we aim to offer valuable insights and predictions for potential investors.
Trend Analysis:
- Moving Averages (MA): The 5-day Moving Average (MA) has been gradually decreasing from 2.972 to 2.928, indicating a short-term bearish trend.
- MACD: The MACD line has shown a slight increase over the last 5 days, suggesting a potential reversal in the bearish momentum.
- EMA: The Exponential Moving Average (EMA) has been on an upward trend, indicating a bullish sentiment in the longer term.
Key Observation: The short-term trend is bearish, while the longer-term trend is slightly bullish.
Momentum Analysis:
- RSI: The Relative Strength Index (RSI) has been relatively stable around the mid-level, indicating a neutral momentum.
- Stochastic Oscillator: Both %K and %D have shown fluctuations but are currently in the neutral zone.
- Williams %R: The Williams %R is hovering around oversold levels, suggesting a potential buying opportunity.
Key Observation: Momentum indicators are mixed, with a slight bias towards a neutral stance.
Volatility Analysis:
- Bollinger Bands: The Bollinger Bands have shown narrowing volatility, indicating a potential decrease in price fluctuations.
- Bollinger %B: The %B indicator is below 1, suggesting the stock is trading below the lower band, potentially indicating an oversold condition.
Key Observation: Volatility is decreasing, and the stock may be oversold based on Bollinger Bands.
Volume Analysis:
- On-Balance Volume (OBV): The OBV has shown a slight increase over the last 5 days, indicating a potential accumulation of the stock.
- Chaikin Money Flow (CMF): The CMF has been on an upward trend, suggesting buying pressure in the stock.
Key Observation: Volume indicators point towards a potential accumulation phase in the stock.
Conclusion:
Based on the analysis of the technical indicators, the next few days' possible stock price movement for BLBX is likely to see a consolidation phase with a slight bullish bias. The short-term trend is bearish, but the longer-term EMA indicates a potential bullish sentiment. Momentum indicators are neutral, while decreasing volatility and increasing volume suggest a possible stabilization and accumulation phase in the stock.
Recommendation: Consider monitoring the stock closely for signs of a reversal in the short-term trend and potential buying opportunities as the stock consolidates.