Technical Analysis of BLDP 2024-05-10
Overview:
In analyzing the technical indicators for BLDP over the last 5 days, we will delve into the trend, momentum, volatility, and volume indicators to provide a comprehensive outlook on the possible stock price movement. By examining these key aspects, we aim to offer valuable insights and recommendations for potential future price trends.
Trend Analysis:
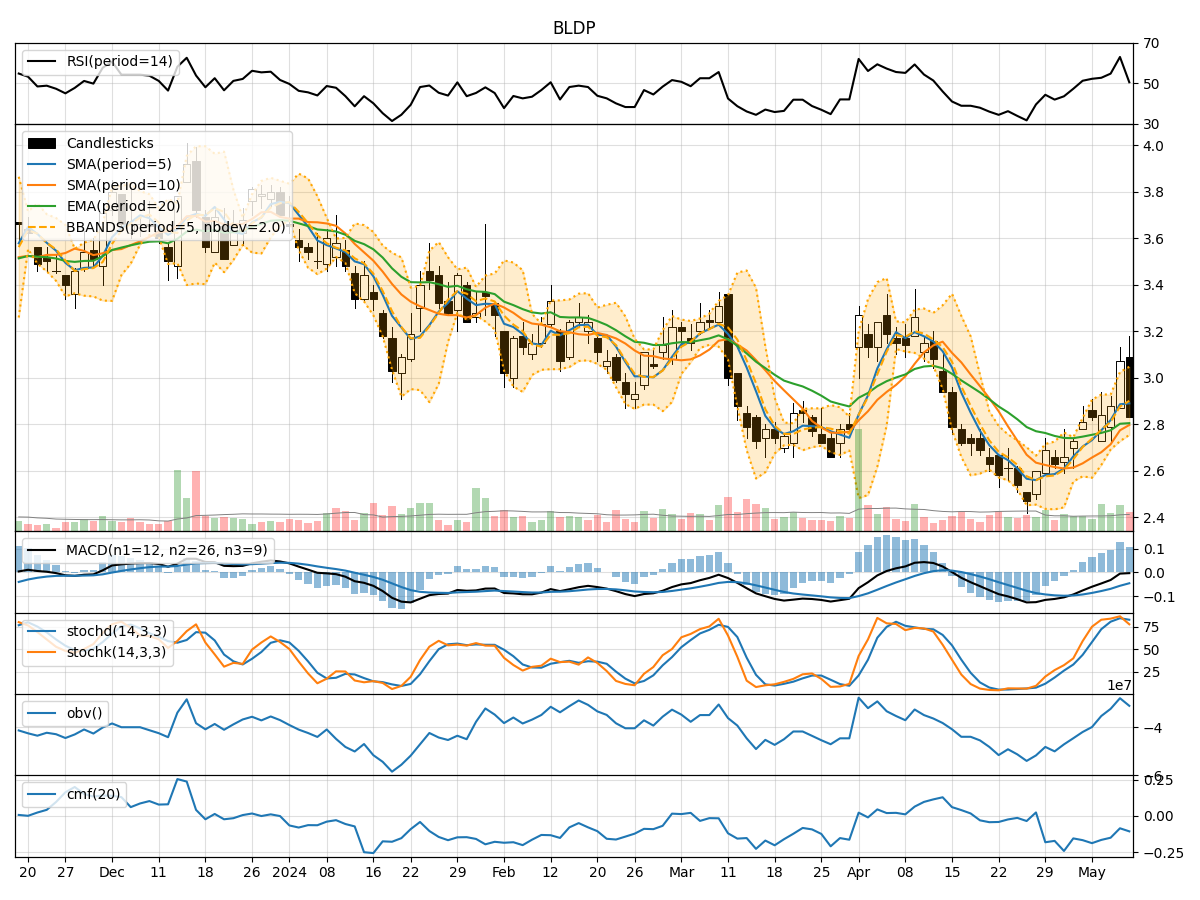
- Moving Averages (MA): The 5-day Moving Average (MA) has been showing an upward trend, indicating a positive momentum in the stock price.
- MACD: The Moving Average Convergence Divergence (MACD) has been consistently positive, suggesting a bullish trend in the short term.
- EMA: The Exponential Moving Average (EMA) has been steadily increasing, supporting the bullish sentiment in the stock.
Momentum Analysis:
- RSI: The Relative Strength Index (RSI) has been fluctuating but generally staying within the neutral range, indicating a balanced momentum.
- Stochastic Oscillator: Both %K and %D have been relatively high, suggesting a bullish momentum in the stock.
- Williams %R: The Williams %R is showing oversold conditions, indicating a potential reversal in the stock price.
Volatility Analysis:
- Bollinger Bands: The Bollinger Bands are widening, indicating increased volatility in the stock price.
- Bollinger %B: The %B indicator is fluctuating but has been mostly below 1, suggesting a potential buying opportunity.
- Average True Range (ATR): The ATR is showing an increase in volatility, which could lead to larger price movements.
Volume Analysis:
- On-Balance Volume (OBV): The OBV has been fluctuating but has shown overall positive accumulation, indicating buying interest in the stock.
- Chaikin Money Flow (CMF): The CMF has been negative, suggesting some selling pressure in the stock.
Key Observations:
- The trend indicators point towards a bullish sentiment in the stock, supported by positive moving averages and MACD.
- Momentum indicators show a mixed picture with RSI in a neutral zone, Stochastic Oscillator indicating bullish momentum, and Williams %R signaling oversold conditions.
- Volatility indicators suggest an increase in price fluctuations, which could lead to both opportunities and risks for traders.
- Volume indicators reflect positive accumulation but with some selling pressure indicated by CMF.
Conclusion:
Based on the analysis of the technical indicators, the next few days' possible stock price movement for BLDP is likely to be bullish. The trend indicators, supported by positive moving averages and MACD, indicate a potential upward trajectory. While some momentum indicators show mixed signals, the overall sentiment leans towards a bullish outlook. Increased volatility could present trading opportunities, and positive accumulation in volume indicators suggests underlying strength in the stock. Traders and investors may consider taking advantage of potential price appreciation in the coming days.