Technical Analysis of BLKB 2024-05-31
Overview:
In analyzing the technical indicators for BLKB over the last 5 days, we will delve into the trend, momentum, volatility, and volume indicators to provide a comprehensive outlook on the possible stock price movement in the coming days. By examining these key aspects, we aim to offer valuable insights and predictions to guide investment decisions.
Trend Analysis:
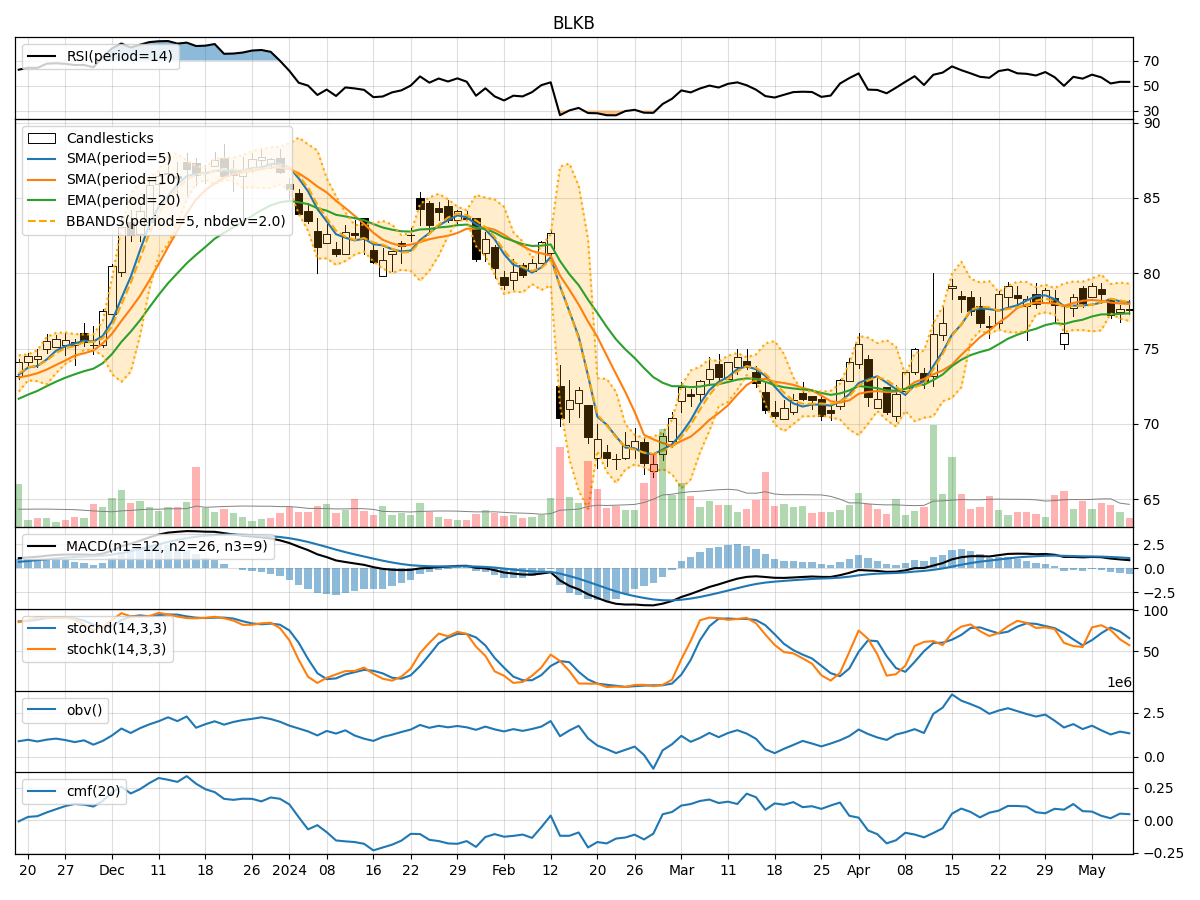
- Moving Averages (MA): The 5-day MA has been consistently below the closing prices, indicating a short-term downtrend.
- MACD: The MACD line has been positive but decreasing, while the MACD Histogram has been in negative territory, suggesting a weakening bullish momentum.
- RSI: The RSI has been fluctuating around the 50 level, indicating indecision in the market.
Momentum Analysis:
- Stochastic Oscillator: Both %K and %D have been in oversold territory, signaling a potential reversal or consolidation.
- Williams %R: The indicator has been deeply oversold, indicating a possible buying opportunity.
Volatility Analysis:
- Bollinger Bands (BB): The stock price has been trading within the lower Bollinger Band, suggesting a potential oversold condition.
- BB Width: The narrowing of the Bollinger Bands indicates decreasing volatility.
Volume Analysis:
- On-Balance Volume (OBV): The OBV has been fluctuating, indicating mixed buying and selling pressure.
- Chaikin Money Flow (CMF): The CMF has been positive but declining, suggesting weakening buying pressure.
Key Observations:
- The stock is currently in a short-term downtrend based on moving averages.
- Momentum indicators show oversold conditions, potentially signaling a reversal or consolidation.
- Volatility is decreasing, indicating a possible stabilization in price movements.
- Volume indicators suggest mixed market sentiment with declining buying pressure.
Conclusion:
Based on the analysis of the technical indicators, the stock price of BLKB is likely to experience further consolidation or a potential reversal in the coming days. The oversold conditions in momentum indicators and the narrowing Bollinger Bands suggest a possible sideways movement or a slight upward correction. However, the mixed signals from volume indicators and the weakening bullish momentum from the MACD warrant caution.
Recommendation:
- Short-term Traders: Consider waiting for confirmation of a trend reversal before entering new positions.
- Long-term Investors: Monitor the price action closely for a potential entry point or consider holding existing positions with a stop-loss in place.
Always remember to conduct thorough research and consider multiple factors before making any investment decisions. Consulting with a financial advisor can provide personalized insights tailored to your specific investment goals and risk tolerance level.