Technical Analysis of BLNK 2024-05-10
Overview:
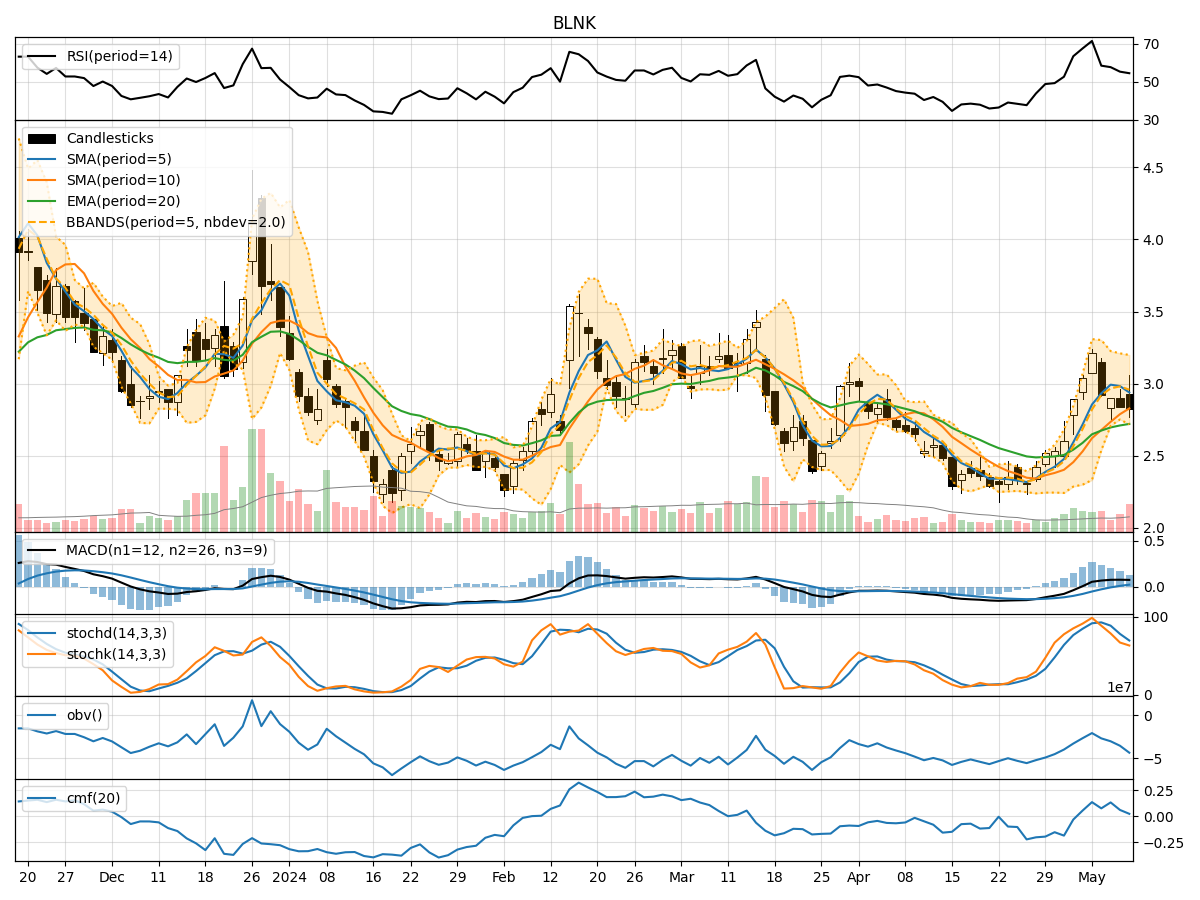
In analyzing the technical indicators for BLNK over the last 5 days, we will delve into the trend, momentum, volatility, and volume indicators to provide a comprehensive outlook on the possible stock price movement. By examining these key aspects, we aim to offer valuable insights and predictions for the upcoming days.
Trend Analysis:
- Moving Averages (MA): The 5-day Moving Average (MA) has been fluctuating around the closing prices, indicating short-term price trends. The Simple Moving Average (SMA) and Exponential Moving Average (EMA) show an overall upward trend, suggesting a positive momentum.
- MACD: The Moving Average Convergence Divergence (MACD) has been positive, with the MACD line consistently above the signal line. This signals a bullish trend in the stock price.
Momentum Analysis:
- RSI: The Relative Strength Index (RSI) has been fluctuating but generally staying above 50, indicating bullish momentum.
- Stochastic Oscillator: Both %K and %D have been declining but are still in the overbought territory, suggesting a potential reversal in the short term.
Volatility Analysis:
- Bollinger Bands (BB): The Bollinger Bands have been narrowing, indicating decreasing volatility. The bands are currently close to the stock price, suggesting a potential breakout in either direction.
Volume Analysis:
- On-Balance Volume (OBV): The OBV has been declining, indicating selling pressure in the stock. This could potentially lead to a downward movement in the stock price.
- Chaikin Money Flow (CMF): The CMF has been fluctuating around zero, indicating a balance between buying and selling pressure.
Key Observations:
- The trend indicators suggest a bullish sentiment in the short term, supported by positive MACD and moving averages.
- Momentum indicators show a mixed signal, with RSI indicating bullish momentum while Stochastic Oscillator suggests a potential reversal.
- Volatility has been decreasing, indicating a period of consolidation and potential breakout.
- Volume indicators point towards selling pressure, which could lead to a downward movement in the stock price.
Conclusion:
Based on the analysis of the technical indicators, the next few days' possible stock price movement for BLNK is likely to be sideways with a slight bearish bias. While the trend indicators suggest a bullish sentiment, the mixed signals from momentum indicators and selling pressure indicated by volume indicators could lead to a period of consolidation or a slight downward correction in the stock price. Traders should closely monitor key support and resistance levels for potential entry or exit points.