Technical Analysis of BMBL 2024-05-10
Overview:
In analyzing the technical indicators for BMBL over the last 5 days, we will delve into the trend, momentum, volatility, and volume indicators to provide a comprehensive outlook on the possible stock price movement. By examining these key aspects, we aim to offer valuable insights and predictions for the upcoming days.
Trend Analysis:
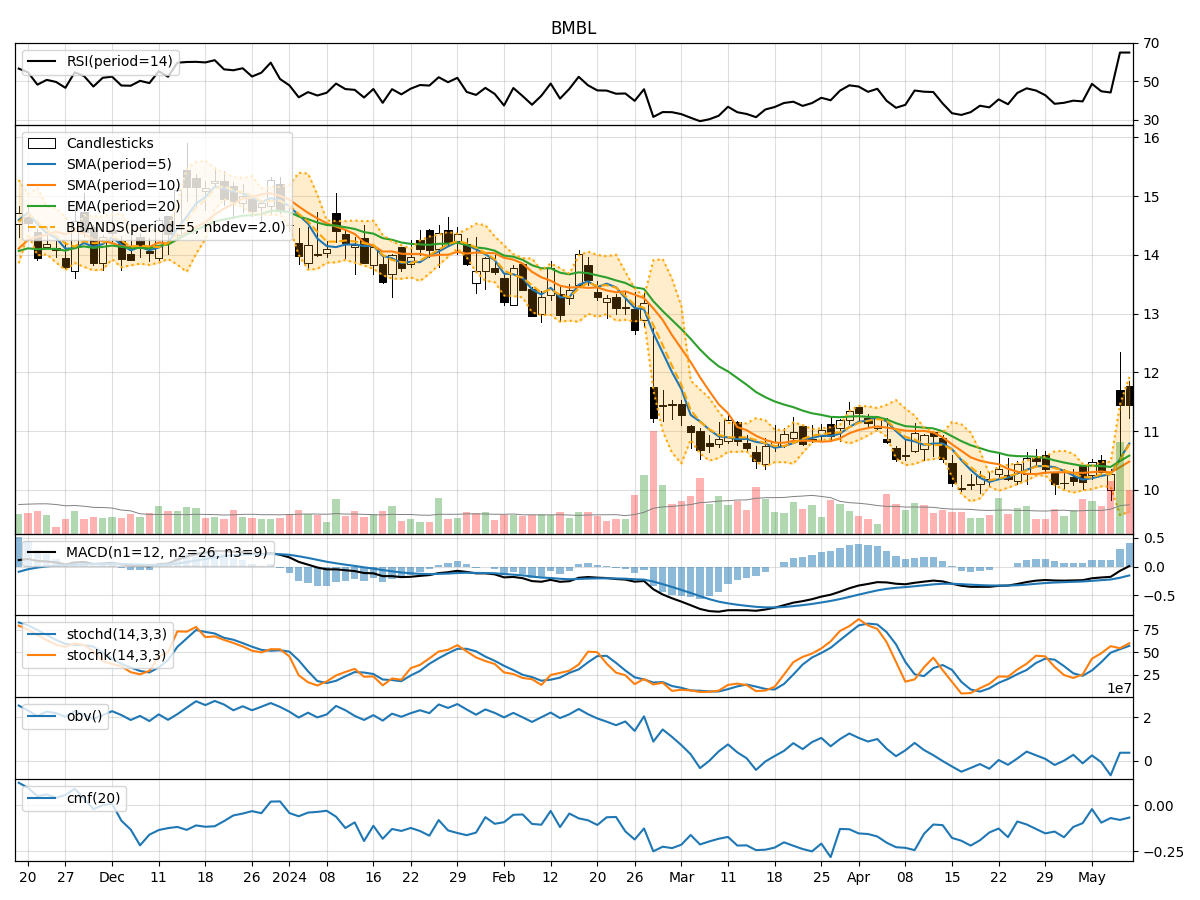
- Moving Averages (MA): The 5-day MA has been steadily increasing, indicating a positive trend in the short term.
- MACD: The MACD line has been consistently below the signal line, suggesting a bearish momentum.
- EMA: The EMA has shown a slight decline, reflecting a potential weakening of the trend.
Momentum Analysis:
- RSI: The RSI has been fluctuating within the neutral zone, indicating indecision in the market.
- Stochastic Oscillator: Both %K and %D have been moving upwards, signaling a potential bullish momentum.
- Williams %R: The indicator has been hovering around oversold levels, suggesting a possible reversal.
Volatility Analysis:
- Bollinger Bands (BB): The stock price has been trading within the bands, indicating a period of consolidation.
- Bollinger Band Width (BBW): The BBW has been relatively stable, suggesting low volatility in the market.
Volume Analysis:
- On-Balance Volume (OBV): The OBV has shown a mixed trend, indicating uncertainty among investors.
- Chaikin Money Flow (CMF): The CMF has been negative, reflecting selling pressure in the market.
Key Observations:
- The trend indicators suggest a mixed outlook, with the moving averages showing a positive trend while the MACD and EMA signal potential weakness.
- Momentum indicators point towards a possible bullish momentum building up, especially indicated by the Stochastic Oscillator.
- Volatility remains low, as depicted by the Bollinger Bands and BBW, indicating a period of consolidation.
- Volume indicators reflect a lack of strong buying or selling pressure, with OBV and CMF showing mixed signals.
Conclusion:
Based on the analysis of the technical indicators, the next few days for BMBL could see sideways movement with a slight bullish bias. The stock may continue to consolidate within a narrow range, with a potential for a modest upside based on the building bullish momentum indicated by the Stochastic Oscillator. However, investors should remain cautious due to the mixed signals from other indicators and the overall uncertainty in the market.