Technical Analysis of BNTX 2024-05-10
Overview:
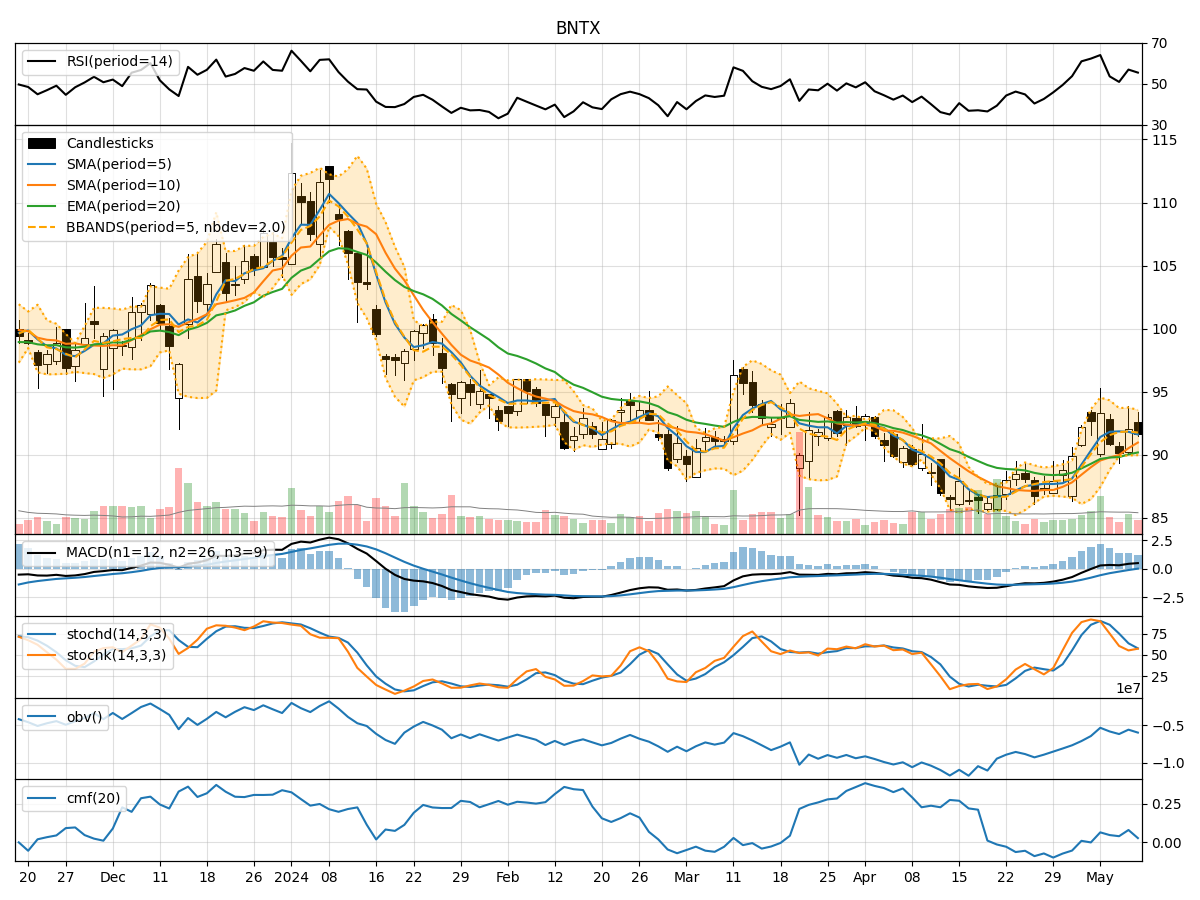
In analyzing the technical indicators for BNTX over the last 5 days, we will delve into the trend, momentum, volatility, and volume indicators to provide a comprehensive outlook on the possible stock price movement in the coming days. By examining these key aspects, we aim to offer valuable insights and predictions for informed decision-making.
Trend Analysis:
- Moving Averages (MA): The 5-day Moving Average (MA) has been fluctuating around the current price, indicating a lack of clear trend direction.
- MACD: The Moving Average Convergence Divergence (MACD) has shown slight positive momentum but remains close to the signal line, suggesting a potential reversal or consolidation.
Momentum Analysis:
- RSI: The Relative Strength Index (RSI) has been oscillating around the neutral zone, indicating a balanced momentum between buying and selling pressure.
- Stochastic Oscillator: Both %K and %D of the Stochastic Oscillator are hovering in the mid-range, reflecting a lack of strong momentum in either direction.
Volatility Analysis:
- Bollinger Bands (BB): The Bollinger Bands have been relatively narrow, indicating low volatility and a potential period of consolidation.
Volume Analysis:
- On-Balance Volume (OBV): The OBV has shown mixed signals with fluctuations in volume, suggesting indecision among market participants.
- Chaikin Money Flow (CMF): The CMF has been positive but relatively low, indicating a moderate inflow of money into the stock.
Key Observations and Opinions:
- Trend: The lack of a clear trend in moving averages and MACD signals potential consolidation or a reversal in the short term.
- Momentum: The balanced RSI and Stochastic Oscillator suggest a neutral momentum with no strong bias towards buying or selling pressure.
- Volatility: The narrow Bollinger Bands point towards a period of low volatility and potential sideways movement.
- Volume: The mixed signals in OBV and moderate CMF indicate uncertainty and a lack of strong conviction among investors.
Conclusion:
Based on the analysis of the technical indicators, the stock price of BNTX is likely to experience sideways movement or consolidation in the coming days. The lack of a clear trend, balanced momentum, low volatility, and mixed volume signals suggest a period of indecision and potential range-bound trading. Investors should exercise caution and closely monitor key levels for any breakout or trend reversal signals before making trading decisions.