Technical Analysis of BOKF 2024-05-10
Overview:
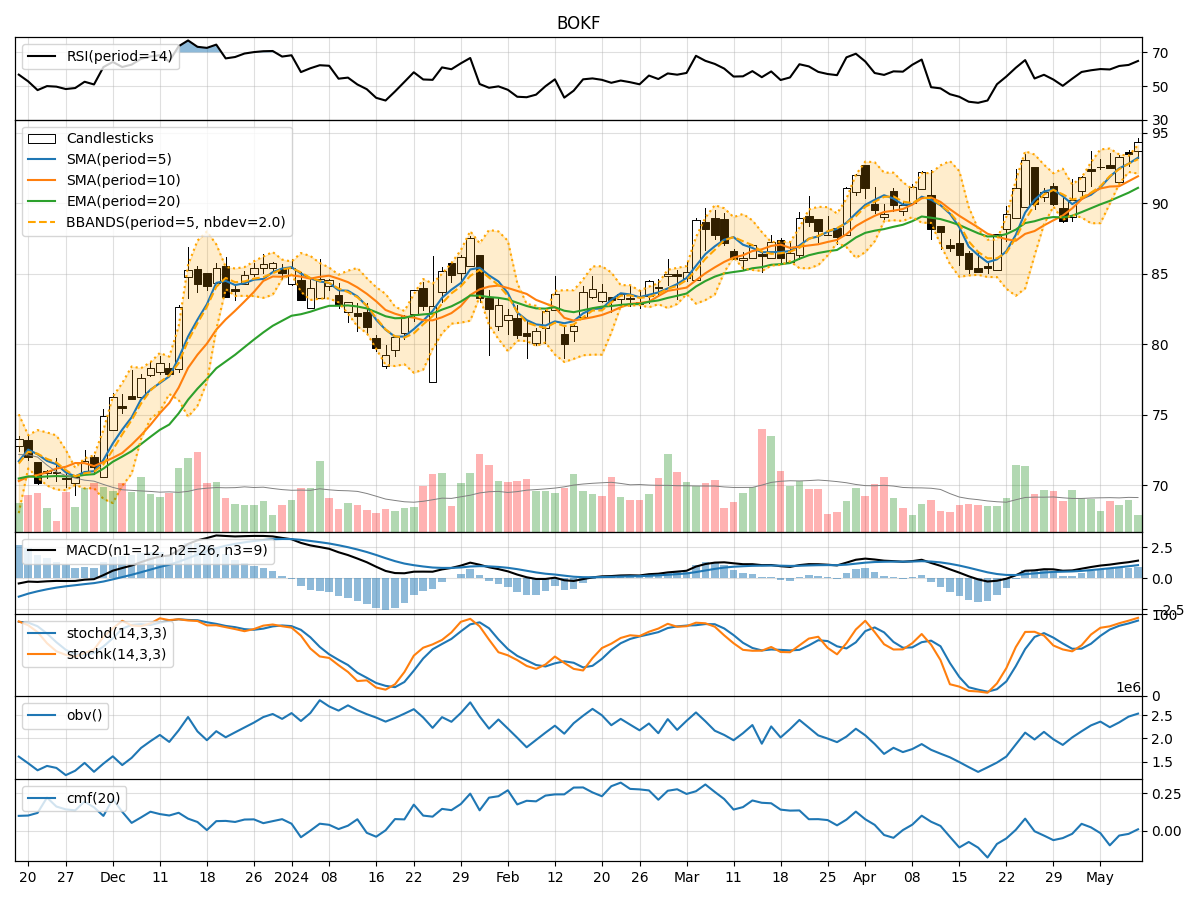
In the last 5 trading days, BOKF stock has shown a consistent uptrend in both price and volume. The moving averages have been trending upwards, indicating a bullish sentiment. Momentum indicators such as RSI and Stochastic oscillators are in overbought territory, suggesting a potential pullback. Volatility indicators like Bollinger Bands show a narrowing range, which could precede a significant price movement. Volume indicators have been mixed, with the On-Balance Volume (OBV) slightly positive and Chaikin Money Flow (CMF) slightly negative.
Trend Indicators:
- Moving Averages (MA): The 5-day MA has been consistently above the longer-term SMAs, indicating a strong bullish trend.
- MACD: The MACD line has been above the signal line, showing positive momentum.
Key Observation: The trend indicators suggest a strong bullish sentiment in the stock.
Momentum Indicators:
- RSI: RSI is in overbought territory, indicating a potential reversal or pullback.
- Stochastic Oscillators: Both %K and %D are in the overbought zone, signaling a possible downturn.
Key Observation: Momentum indicators suggest a potential short-term correction or consolidation.
Volatility Indicators:
- Bollinger Bands (BB): The bands are narrowing, indicating a period of low volatility that could precede a significant price movement.
Key Observation: Volatility is contracting, hinting at a potential breakout or breakdown.
Volume Indicators:
- On-Balance Volume (OBV): The OBV has shown a slight increase, reflecting positive volume flow.
- Chaikin Money Flow (CMF): The CMF is slightly negative, suggesting some distribution.
Key Observation: Volume indicators are mixed, with a slight positive bias.
Conclusion:
Based on the technical analysis of BOKF stock: - Trend: The stock is in a strong upward trend. - Momentum: Momentum indicators suggest a potential short-term correction or consolidation. - Volatility: Volatility is contracting, indicating a possible breakout or breakdown. - Volume: Volume indicators are mixed but slightly positive.
Overall View:
Considering the bullish trend, potential short-term correction indicated by momentum indicators, and the contracting volatility pointing towards a significant price movement, the next few days for BOKF stock are likely to see consolidation or a pullback before a possible breakout or breakdown. Traders should be cautious of the overbought conditions and monitor the price action closely for potential entry or exit points.