Technical Analysis of BRY 2024-05-10
Overview:
In analyzing the technical indicators for BRY over the last 5 days, we will delve into the trend, momentum, volatility, and volume indicators to provide a comprehensive outlook on the possible stock price movement in the coming days. By examining these key aspects, we aim to offer valuable insights and predictions for potential investors.
Trend Analysis:
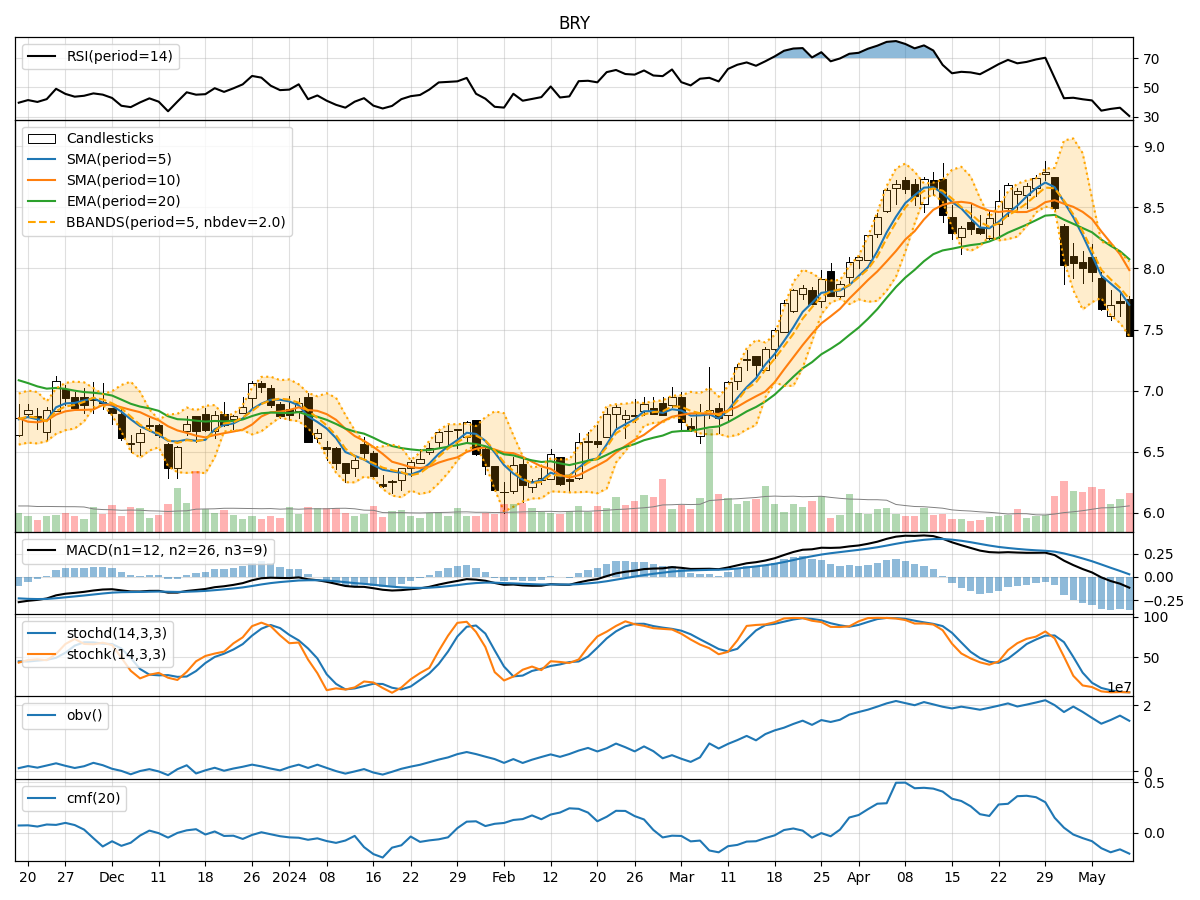
- Moving Averages (MA): The 5-day MA has been consistently below the closing prices, indicating a downward trend.
- MACD: The MACD line has been negative and decreasing, suggesting a bearish momentum.
- EMA: The EMA has been declining, further supporting the bearish trend.
Momentum Analysis:
- RSI: The RSI has been below 50, indicating bearish momentum.
- Stochastic Oscillator: Both %K and %D have been low, signaling oversold conditions.
- Williams %R: The indicator has been in the oversold territory, reflecting bearish sentiment.
Volatility Analysis:
- Bollinger Bands (BB): The stock price has been consistently below the lower Bollinger Band, indicating increased volatility and potential oversold conditions.
- Bollinger Band Width (BBW): The BBW has been widening, suggesting increased price volatility.
Volume Analysis:
- On-Balance Volume (OBV): The OBV has been declining, indicating selling pressure.
- Chaikin Money Flow (CMF): The CMF has been negative, reflecting bearish money flow.
Key Observations and Opinions:
- Trend: The trend indicators, including MA, MACD, and EMA, all point towards a strong bearish trend in the stock price.
- Momentum: Momentum indicators like RSI, Stochastic Oscillator, and Williams %R all suggest oversold conditions and bearish momentum.
- Volatility: The widening Bollinger Bands and decreasing stock price below the lower band indicate increased volatility and potential for a rebound.
- Volume: The declining OBV and negative CMF highlight selling pressure and bearish sentiment in the market.
Conclusion:
Based on the analysis of the technical indicators, the next few days for BRY are likely to see further downward movement in the stock price. The strong bearish trend, oversold conditions, increased volatility, and selling pressure all point towards a bearish outlook. Investors should exercise caution and consider waiting for signs of a potential reversal before considering any long positions.