Technical Analysis of BSY 2024-05-10
Overview:
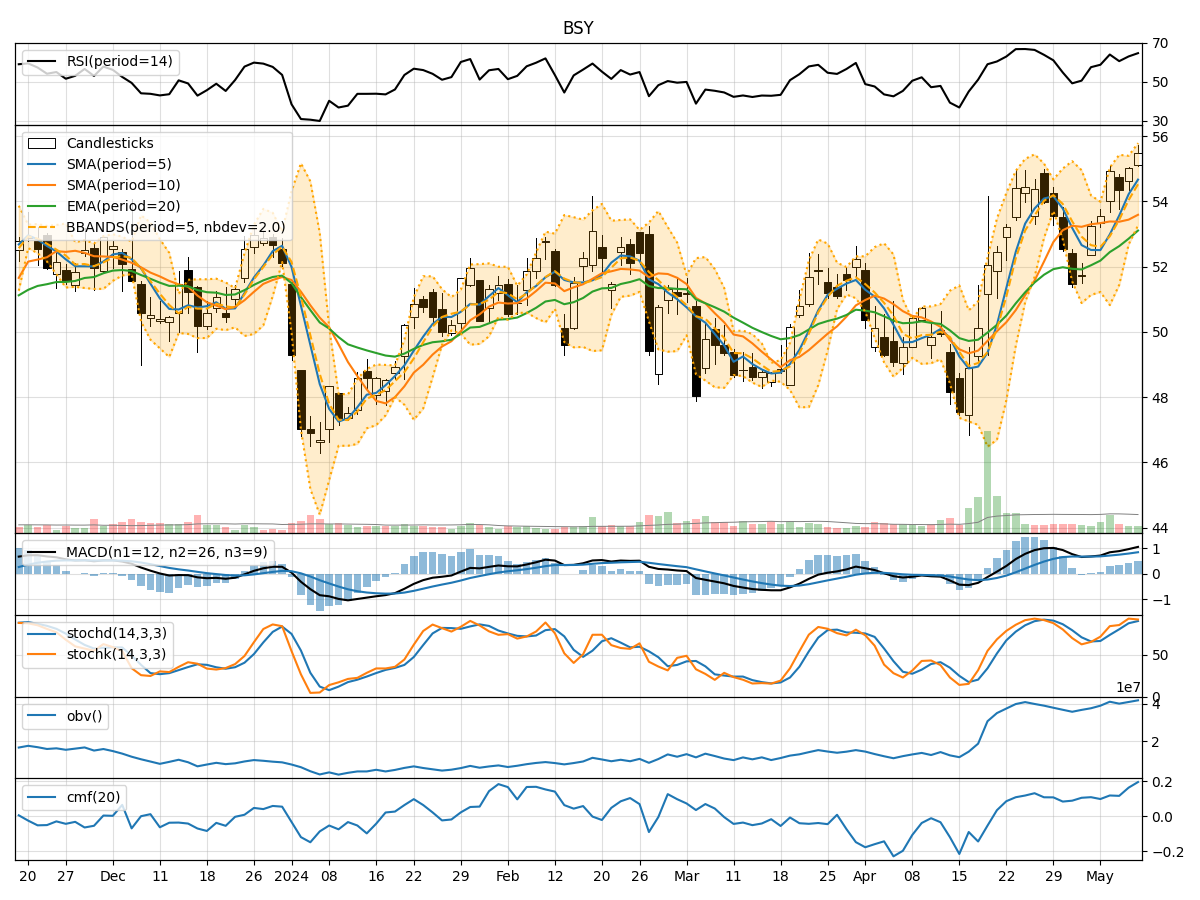
In analyzing the technical indicators for BSY over the last 5 days, we will delve into the trend, momentum, volatility, and volume indicators to provide a comprehensive outlook on the possible stock price movement in the coming days.
Trend Analysis:
- Moving Averages (MA): The 5-day Moving Average (MA) has been consistently rising, indicating a bullish trend.
- MACD: The MACD line has been above the signal line, suggesting a bullish momentum.
- EMA: The Exponential Moving Average (EMA) has also been trending upwards, supporting the bullish sentiment.
Momentum Analysis:
- RSI: The Relative Strength Index (RSI) has been increasing, showing strengthening momentum.
- Stochastic Oscillator: Both %K and %D have been in the overbought zone, indicating a strong bullish momentum.
- Williams %R: The Williams %R is in the oversold region, suggesting a potential reversal.
Volatility Analysis:
- Bollinger Bands (BB): The stock price has been trading near the upper Bollinger Band, indicating high volatility.
- BB Width: The Bollinger Band width has been expanding, suggesting increased price volatility.
Volume Analysis:
- On-Balance Volume (OBV): The OBV has been steadily increasing, indicating strong buying pressure.
- Chaikin Money Flow (CMF): The CMF has been positive, reflecting a bullish money flow into the stock.
Key Observations:
- The trend indicators, momentum indicators, and volume indicators all point towards a bullish sentiment.
- The volatility indicators suggest that the stock is experiencing high volatility, which could lead to significant price movements.
- The increasing OBV and positive CMF further support the bullish outlook for the stock.
Conclusion:
Based on the analysis of the technical indicators, it is highly likely that BSY will experience further upward movement in the coming days. The bullish trend, strong momentum, positive volume flow, and high volatility all align to support a positive outlook for the stock. Traders and investors may consider taking long positions or holding onto existing positions to capitalize on the expected price appreciation.