Technical Analysis of BUJA 2024-05-10
Overview:
In analyzing the technical indicators for BUJA over the last 5 days, we will delve into the trend, momentum, volatility, and volume indicators to provide a comprehensive outlook on the possible stock price movement. By examining these key aspects, we aim to offer valuable insights and predictions for the upcoming trading days.
Trend Analysis:
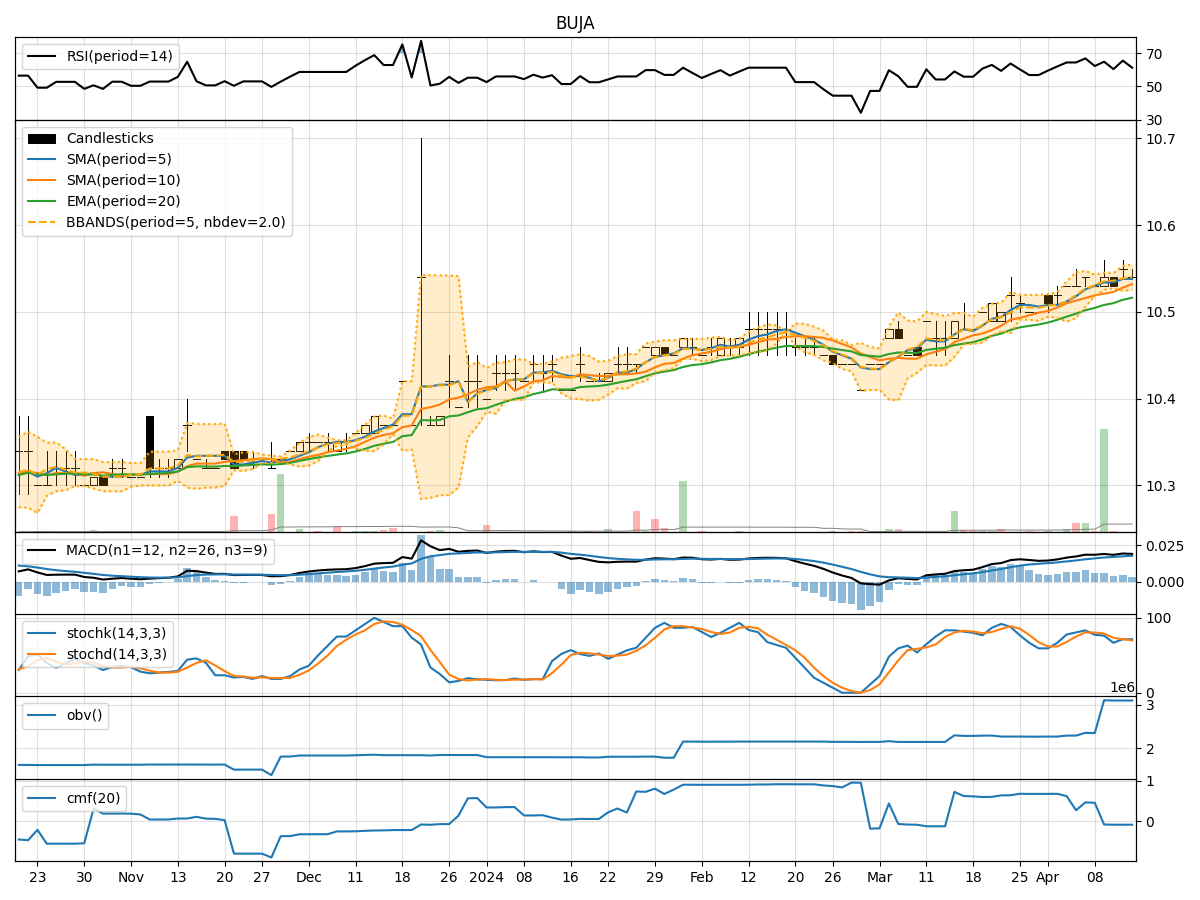
- Moving Averages (MA): The 5-day Moving Average (MA) has been consistently above the Simple Moving Average (SMA) and Exponential Moving Average (EMA), indicating a positive trend.
- MACD: The MACD line has been consistently above the signal line, with the MACD Histogram mostly in positive territory, suggesting bullish momentum.
Momentum Analysis:
- RSI: The Relative Strength Index (RSI) has been fluctuating around the 60-70 range, indicating moderate bullish momentum.
- Stochastic Oscillator: Both %K and %D have been trending upwards, reaching overbought levels, suggesting a potential reversal or consolidation.
Volatility Analysis:
- Bollinger Bands (BB): The stock price has mostly stayed within the Bollinger Bands, with the bands widening slightly, indicating increased volatility.
- Bollinger %B: The %B indicator has been fluctuating within the bands, suggesting potential shifts in price direction.
Volume Analysis:
- On-Balance Volume (OBV): The OBV has been relatively stable, indicating consistent buying pressure.
- Chaikin Money Flow (CMF): The CMF has been positive, reflecting strong buying pressure over the 20-day period.
Key Observations:
- The trend indicators suggest a bullish sentiment, supported by the moving averages and MACD.
- Momentum indicators show a mixed signal, with RSI indicating moderate bullish momentum and Stochastic Oscillator signaling potential overbought conditions.
- Volatility has increased slightly, as seen in the widening Bollinger Bands.
- Volume indicators point towards consistent buying pressure, as reflected in OBV and CMF.
Conclusion:
Based on the analysis of the technical indicators, the overall outlook for BUJA in the next few days leans towards a continuation of the bullish trend. However, caution is advised as the stock may experience short-term consolidation or a minor pullback due to the overbought conditions highlighted by the Stochastic Oscillator. Traders should monitor key support and resistance levels for potential entry or exit points.
Recommendation:
- Short-term Traders: Consider taking profits or tightening stop-loss levels to manage risk.
- Long-term Investors: Hold positions with a focus on the bullish trend, but remain vigilant for potential reversals.
- Risk Management: Implement proper risk management strategies to protect gains and minimize losses in case of unexpected market movements.
By combining technical analysis with prudent risk management, investors can navigate the market dynamics effectively and make informed decisions aligned with their investment goals.