Technical Analysis of BWMX 2024-05-10
Overview:
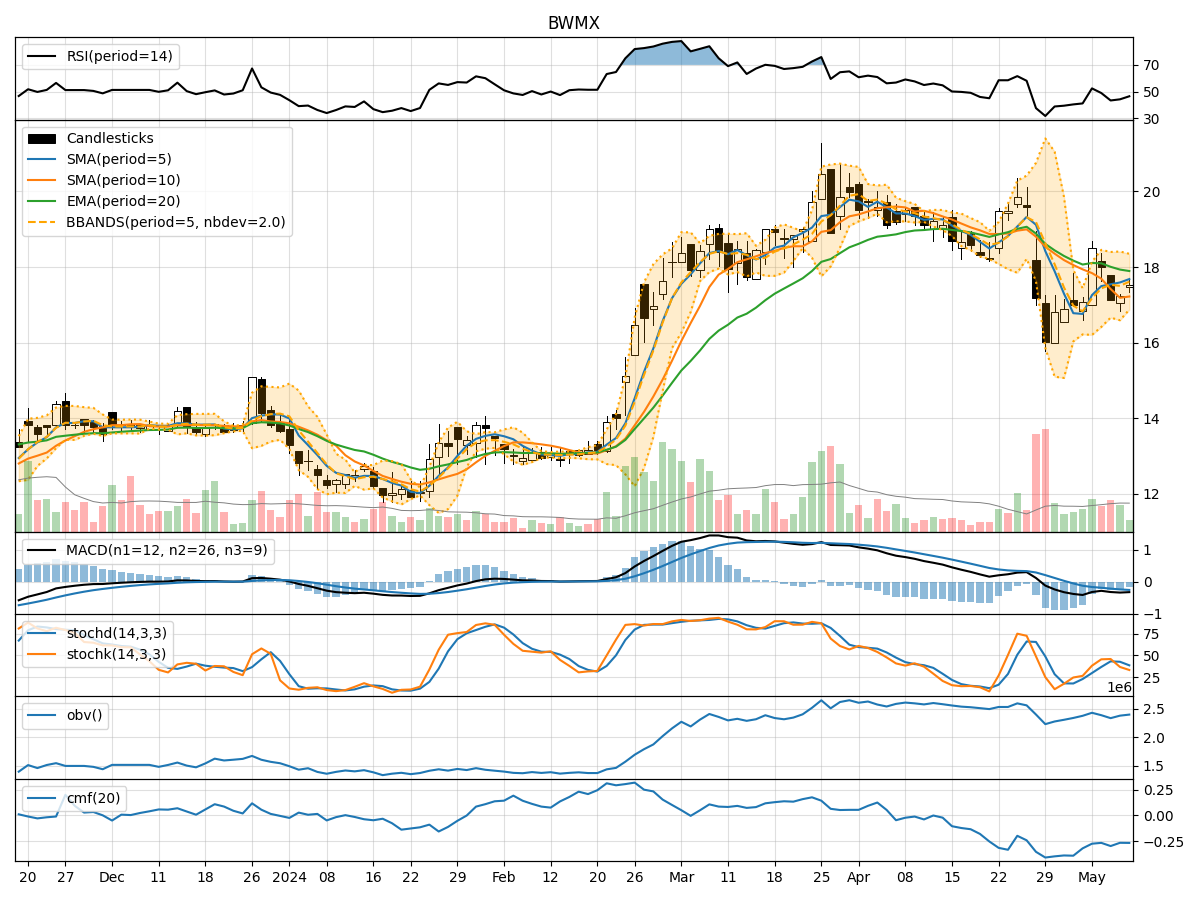
In analyzing the technical indicators for BWMX over the last 5 days, we will delve into the trend, momentum, volatility, and volume indicators to provide a comprehensive outlook on the possible stock price movement. By examining these key aspects, we aim to offer valuable insights and predictions for the upcoming days.
Trend Analysis:
- Moving Averages (MA): The 5-day Moving Average (MA) has been fluctuating around the SMA(10) and EMA(20) levels, indicating a lack of clear trend direction.
- MACD: The MACD line has been consistently below the signal line, suggesting a bearish momentum in the short term.
- RSI: The RSI has been hovering around the neutral zone, indicating a balanced market sentiment without strong overbought or oversold conditions.
Momentum Analysis:
- Stochastic Oscillator: The Stochastic Oscillator has been showing mixed signals, with fluctuations in both %K and %D values, reflecting indecision in momentum.
- Williams %R (Willr): The Williams %R has been oscillating in the oversold territory, indicating a potential reversal or consolidation phase.
Volatility Analysis:
- Bollinger Bands (BB): The Bollinger Bands have been narrowing, suggesting decreasing volatility and a possible period of consolidation.
- BB% (BB Percentage): The BB% has been declining, indicating a compression in price movement and a potential breakout scenario.
Volume Analysis:
- On-Balance Volume (OBV): The OBV has shown mixed movements, reflecting uncertainty in the accumulation/distribution of the stock.
- Chaikin Money Flow (CMF): The CMF has been negative, indicating selling pressure and a lack of strong buying interest.
Key Observations:
- The stock is currently in a consolidation phase with no clear trend direction.
- Momentum indicators suggest a lack of strong bullish or bearish momentum.
- Volatility is decreasing, indicating a potential period of price stabilization.
- Volume indicators reflect mixed signals, pointing towards indecision among market participants.
Conclusion:
Based on the analysis of the technical indicators, the next few days for BWMX are likely to see sideways movement with a potential for consolidation. The lack of a clear trend, mixed momentum signals, decreasing volatility, and uncertain volume patterns all point towards a period of indecision and range-bound trading. Traders should exercise caution and wait for clearer signals before making significant trading decisions.